Chapter 6 Exercises
-
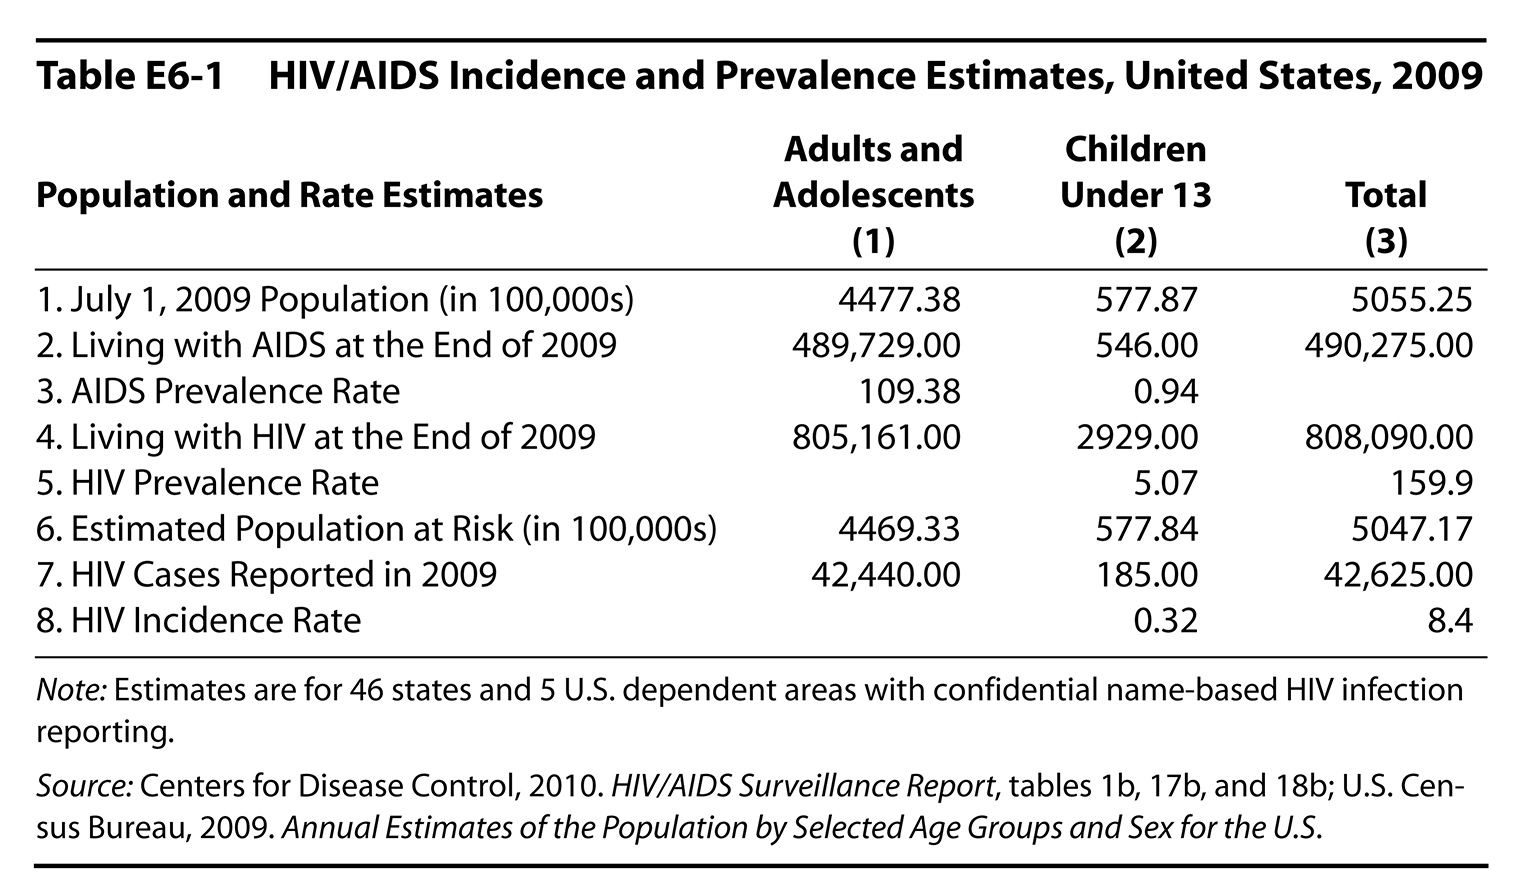
Table E6-1 shows the reported prevalence and incidence of HIV/AIDS in the United States during 2009. Dividing the prevalence of AIDS in row 2 by the population (in 100,000s) of row 1 gives us the prevalence rate per 100,000 population shown in row 3 of the table. Looking at column 1, for example, 109.38 of every 100,000 adults and adolescents lived with AIDS in 2009.
Dividing the number of people with HIV in row 4 by the population in row 1 gives the prevalence of HIV (without AIDS) in row 5.
Finally, row 6 estimates the population at risk of contracting a new HIV infection (again in 100,000s) during the year and row 7 reports the new HIV cases reported during 2009. Dividing these new cases by the population at risk gives the incidence rates reported in row 8 of the table.
Your exercise is to fill in the three blank cells of this table.
-
On May 4 the Morbidity and Mortality Weekly Report carried this story:
Human Rabies—New York
A 29-year-old male U.S. Army soldier with progressive right arm and shoulder pain, nausea, vomiting, ataxia, anxiety, and dysphagia was admitted to an emergency department (ED) in New York for suspected rabies. An Afghanistan canine rabies virus variant was identified. The patient underwent an experimental treatment protocol but died on August 31.
From the most recent life table (use Table E5-1 of the previous chapter), how many years of life were lost due to this single death?
YLL = ————
-
On April 30 the Morbidity and Mortality Weekly Report carried this story:
Outbreak of Poliomyelitis—Angola
On March 23 the Pediatric Hospital in Luanda, Angola, reported 21 cases (three deaths) of acute flaccid paralysis (AFP). . . . By April 25, 635 AFP cases (39 deaths) were reported.
Further investigation determined that these cases occurred primarily among children under age five not fully vaccinated for polio.
-
For the cases that did not result in death, the estimated duration of poliomyelitis would be up to 58.9 years (Murray and Lopez, 1996a). (Let’s assume survivors lived this long.) Using a severity, or disability, of 0.24 (24% disabled), compute how many years lived with disability could have been caused by this outbreak.
YLD = —————
-
If the 39 cases resulting in death had an average remaining life expectancy of 58.9 years, how many years of life were lost due to their deaths?
YLL = —————
-
How many total disability adjusted life-years lost (DALY) were caused by this outbreak?
DALY = YLL + YLD = —————
-
Charts
Figure 6.1
Figure 6.2
Figure 6.3
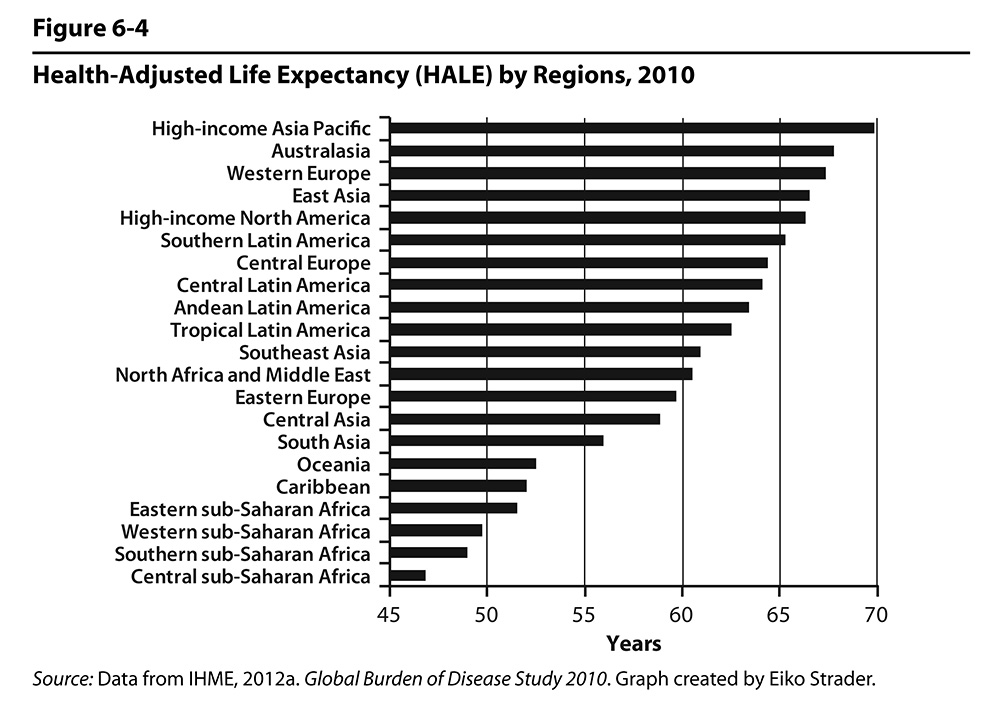
Figure 6.4
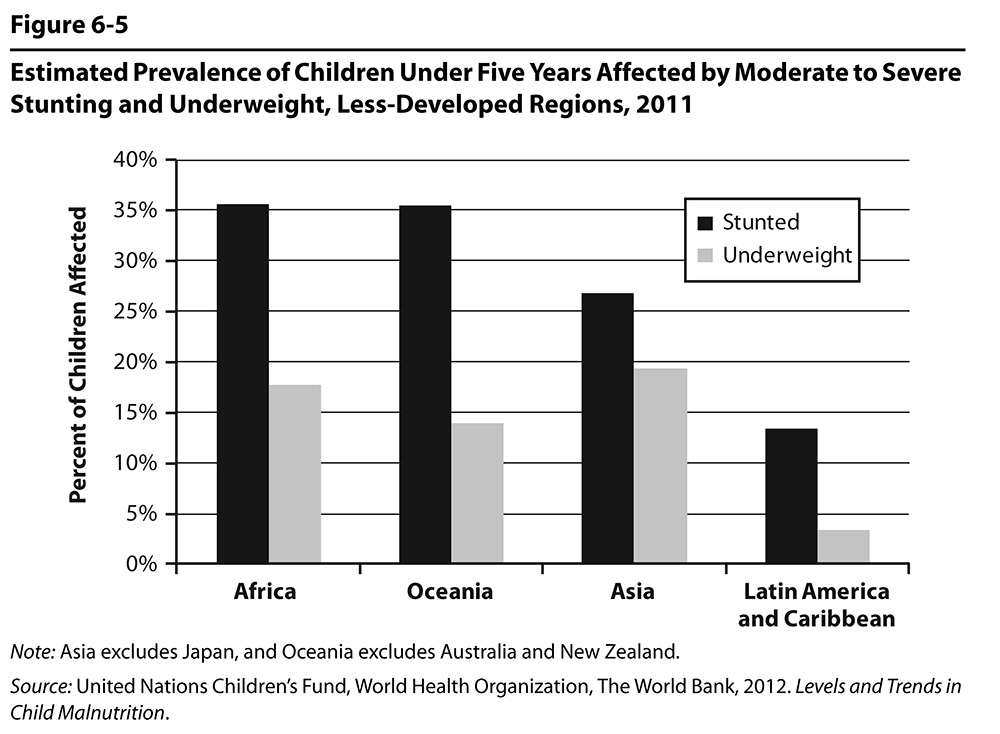
Figure 6.5
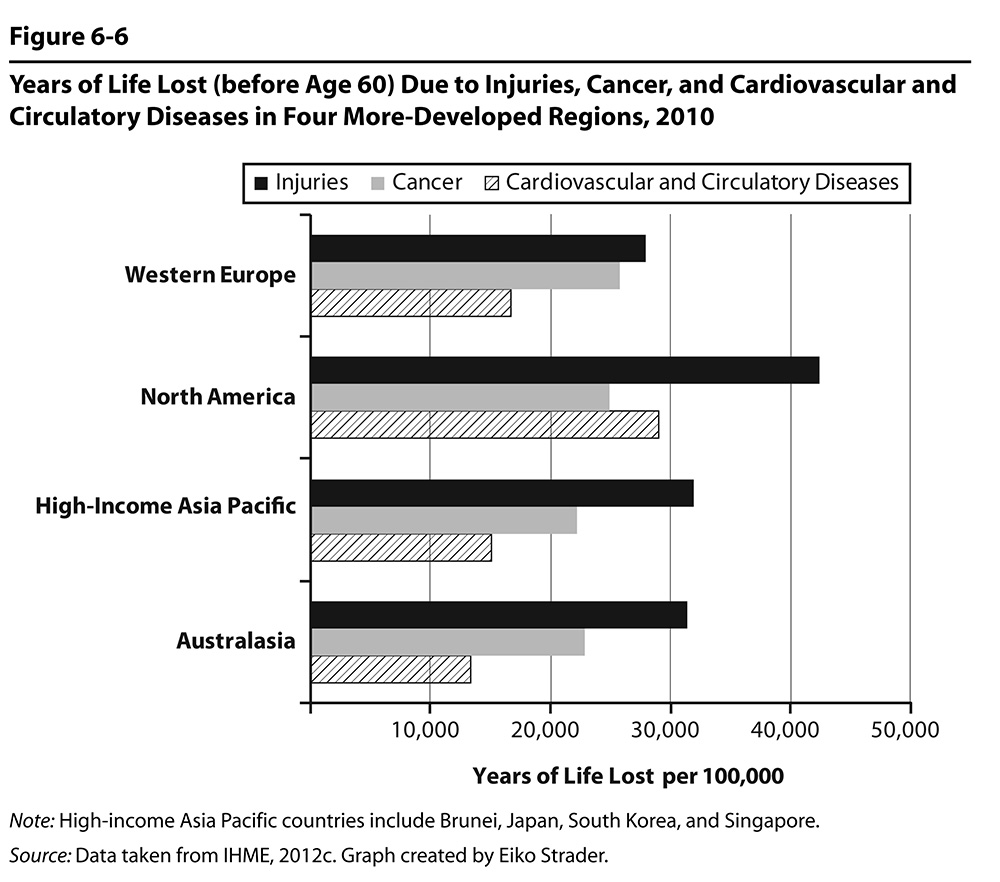
Figure 6.6