Chapter 7 Exercises
-
Table E7-1 presents all of the information necessary for computing a general fertility rate (GFR) and a total fertility rate (TFR) for Brazil for 2015. (The table is similar in structure to Table 7-1.)
-
There are two missing entries each in columns 3 and 4. Fill them in, following the directions at the head of each column.
-
Compute the general fertility rate (GFR) by using the formula: GFR = (B/P15–49) × 1,000, where B is the total births in the year and P15–49 is the total number of women aged fifteen through forty-nine in the year. Be sure to use the total of column 2 for the annual births and round to one decimal place.
-
Compute the total fertility rate (TFR) by totaling column 4 and dividing by 1,000. Or you can add column 3, then multiply the total by 5 and divide by 1,000. Round to one decimal place.
-
Compute the gross reproduction rate (GRR) by assuming that the proportion of total births that are female is .48. That is, multiply the (unrounded) TFR by that proportion. Round to two decimal places.
-
Table E7-2 on the following page presents the data necessary for computing legal 2009 abortion rates and ratios. Compute the missing rates and ratios for the “Non-Hispanic Black,” “Non-Hispanic Other,” and “Hispanic” categories. Follow the computations provided for whites. Enter your answers in the blank spaces in the table.
-
Compare all Hispanic women to all Non-Hispanic women using both the rate and ratio. What effect does the relative fertility of the two groups of women have on this comparison?
Charts

Figure 7.1
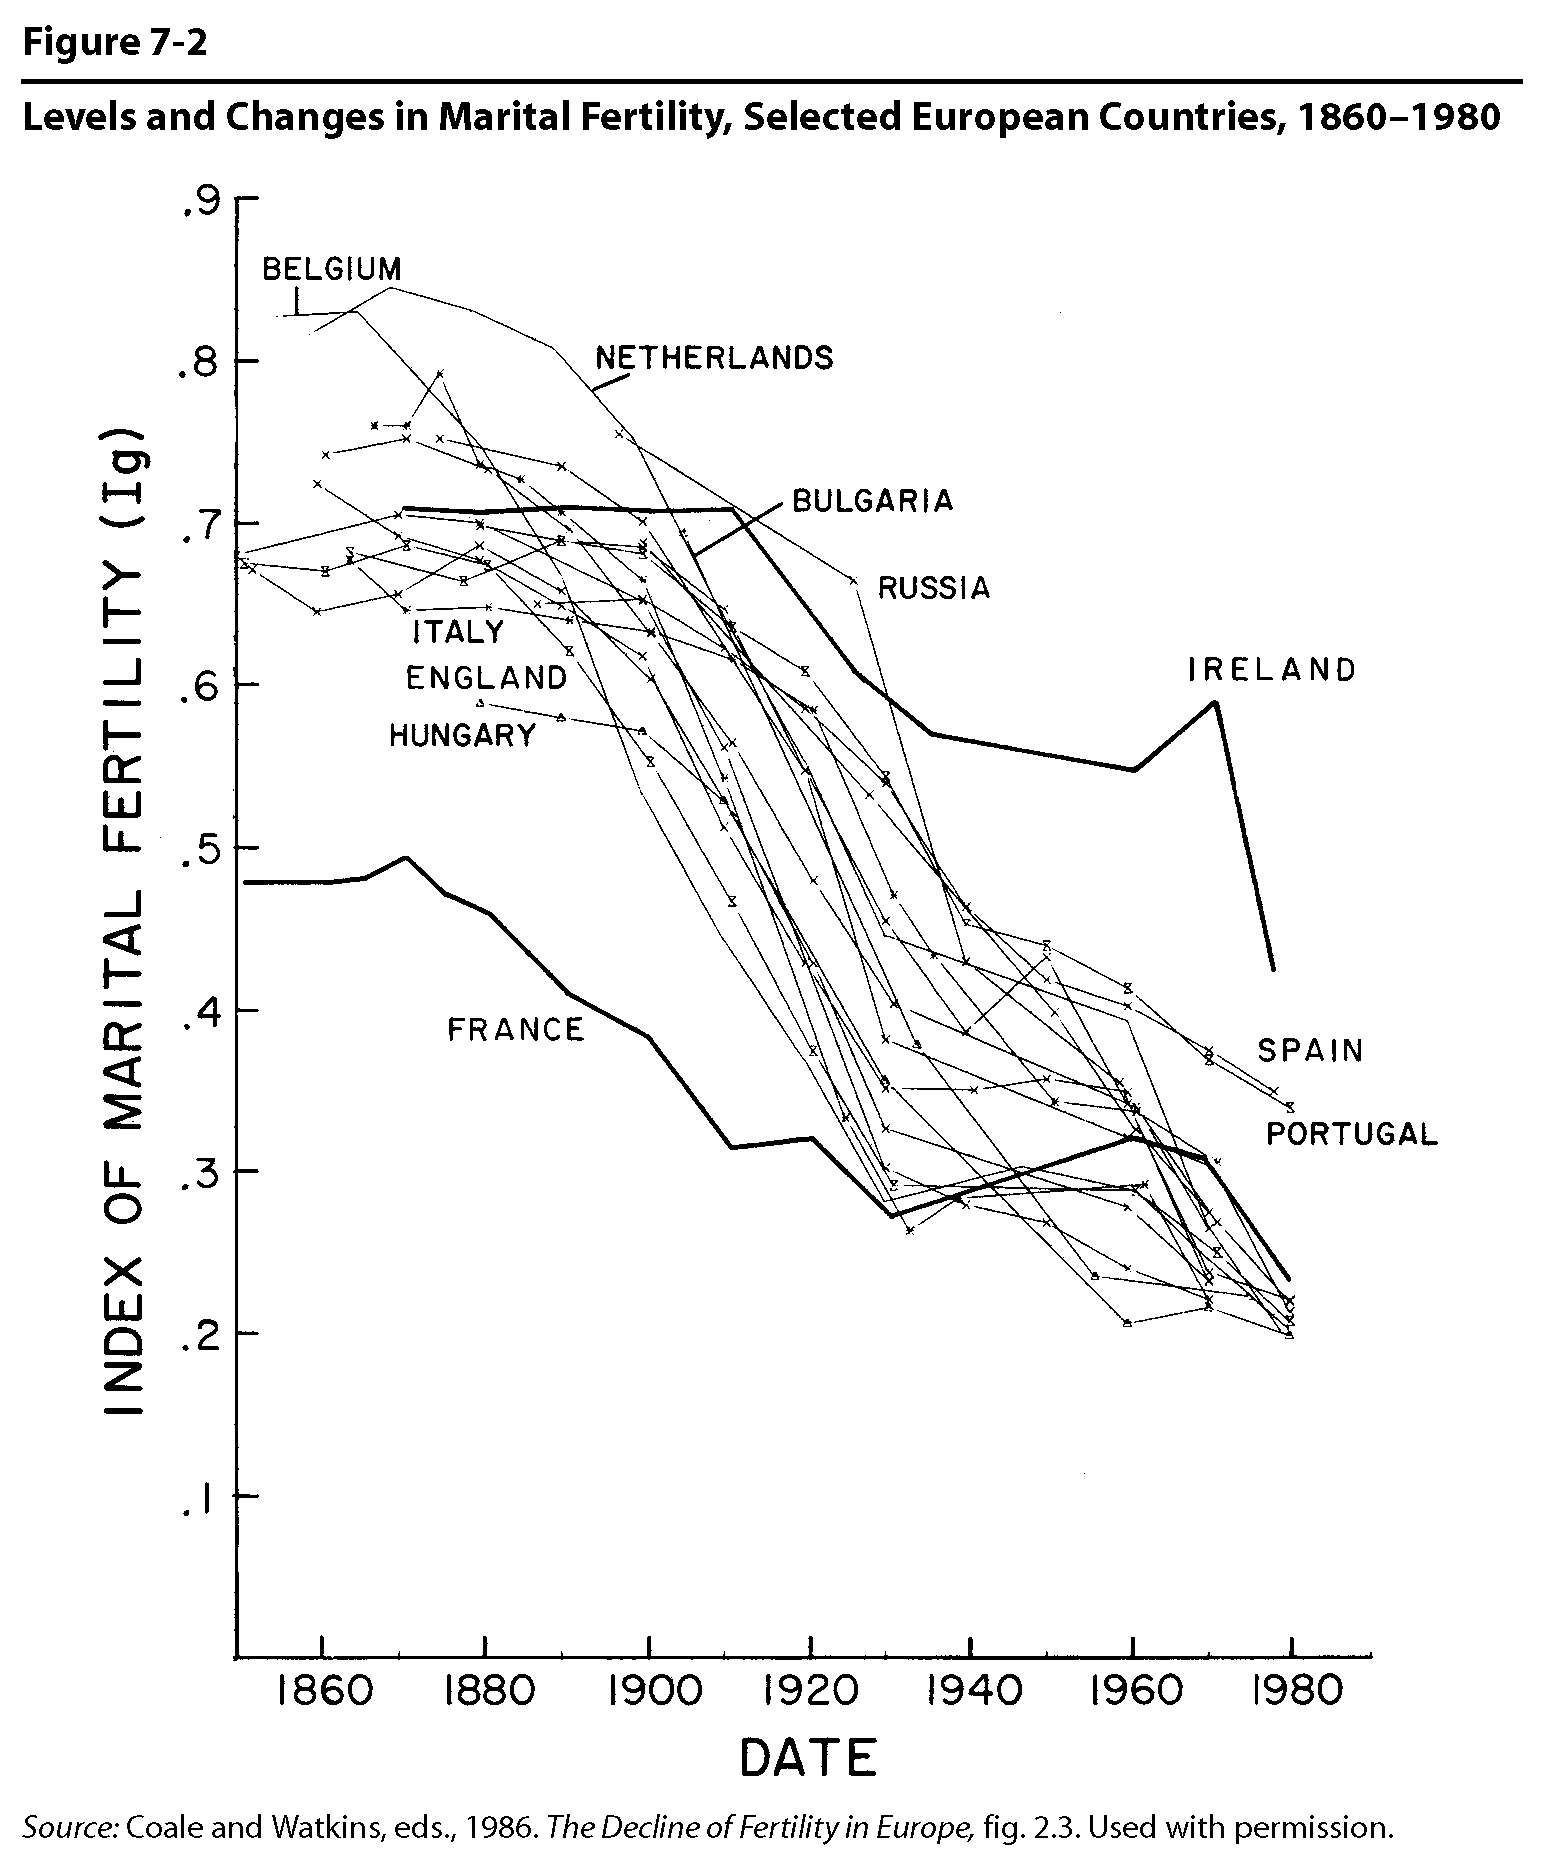
Figure 7.2
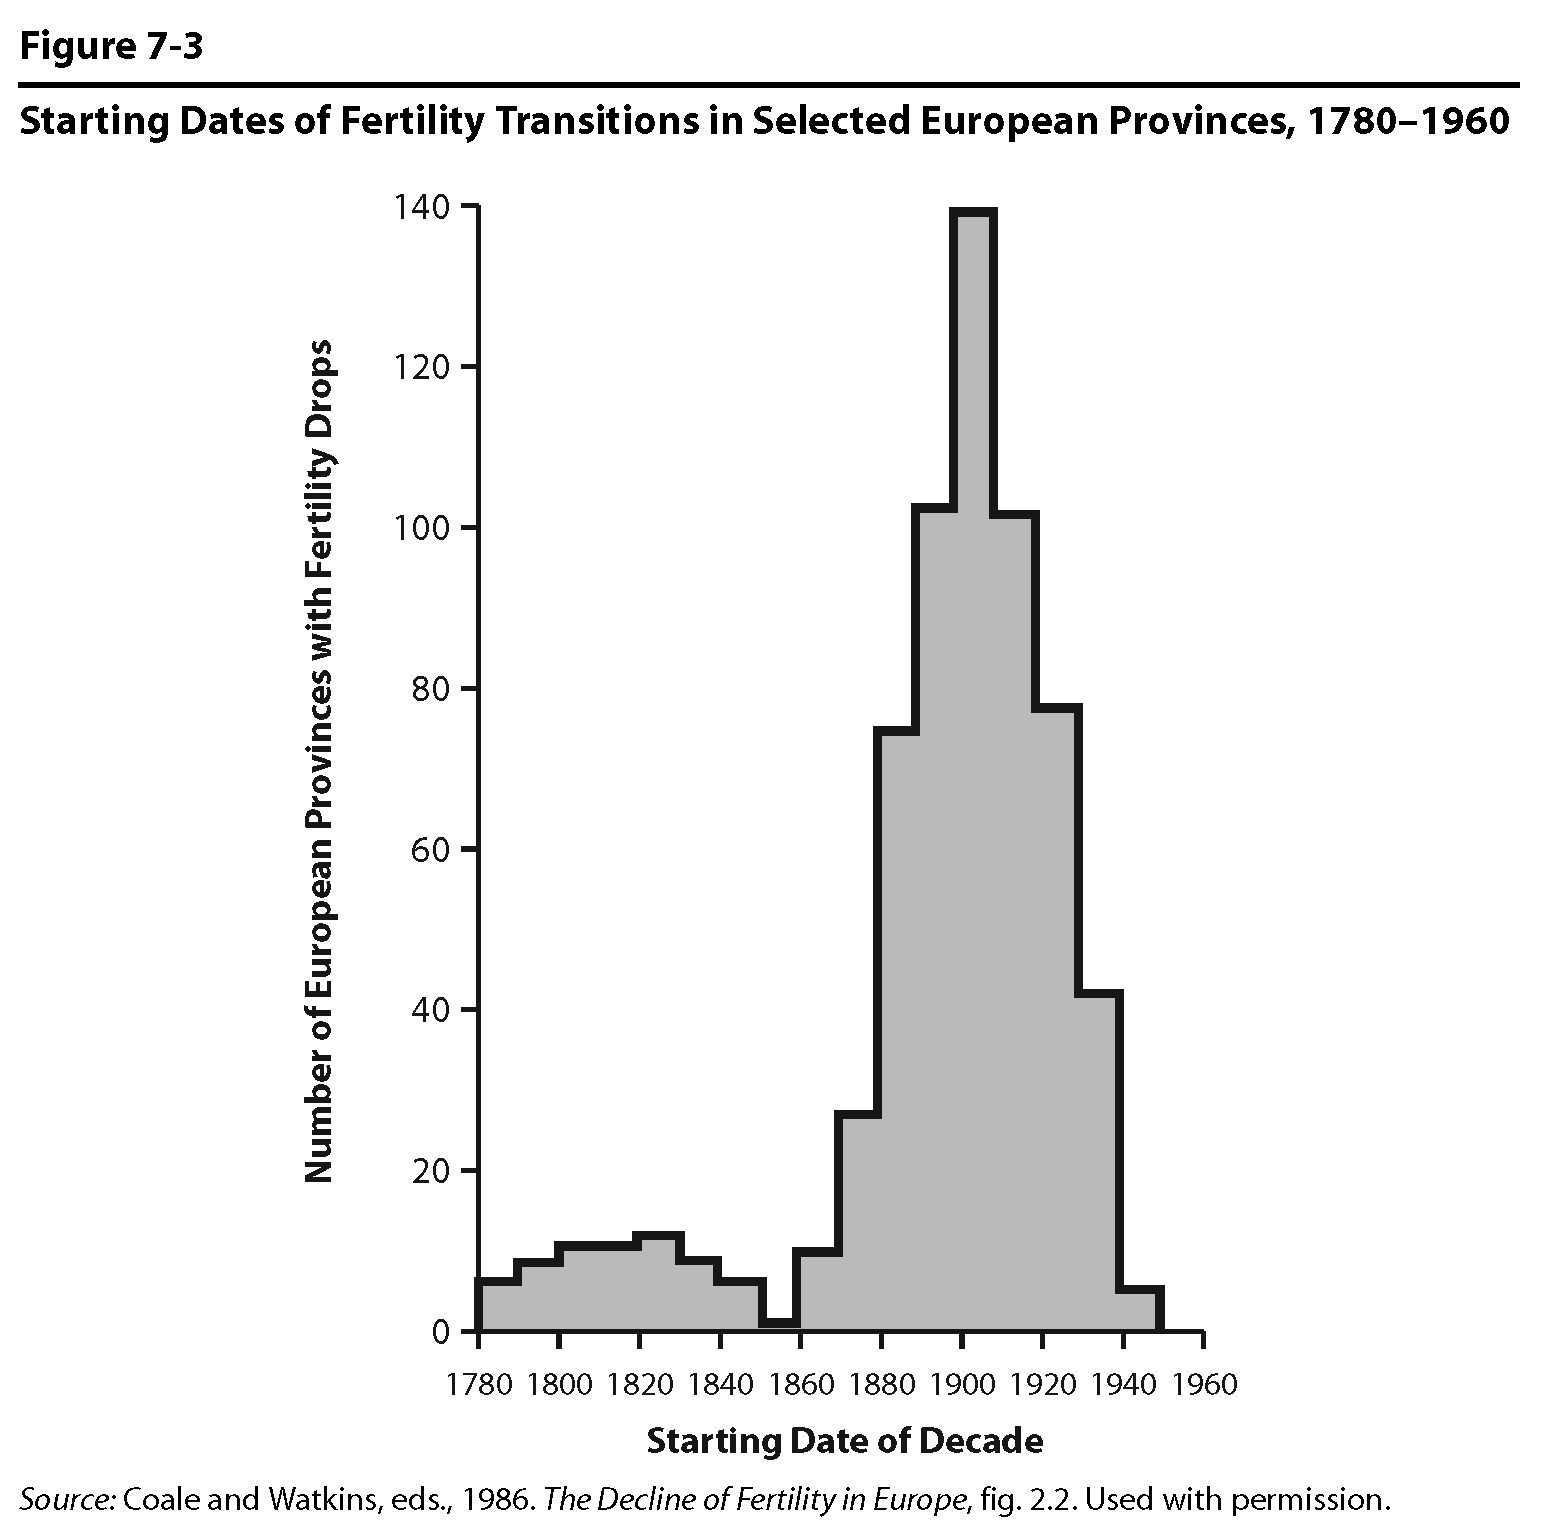
Figure 7.3
Figure 7.4
Figure 7.5
Figure 7.6
Figure 7.7
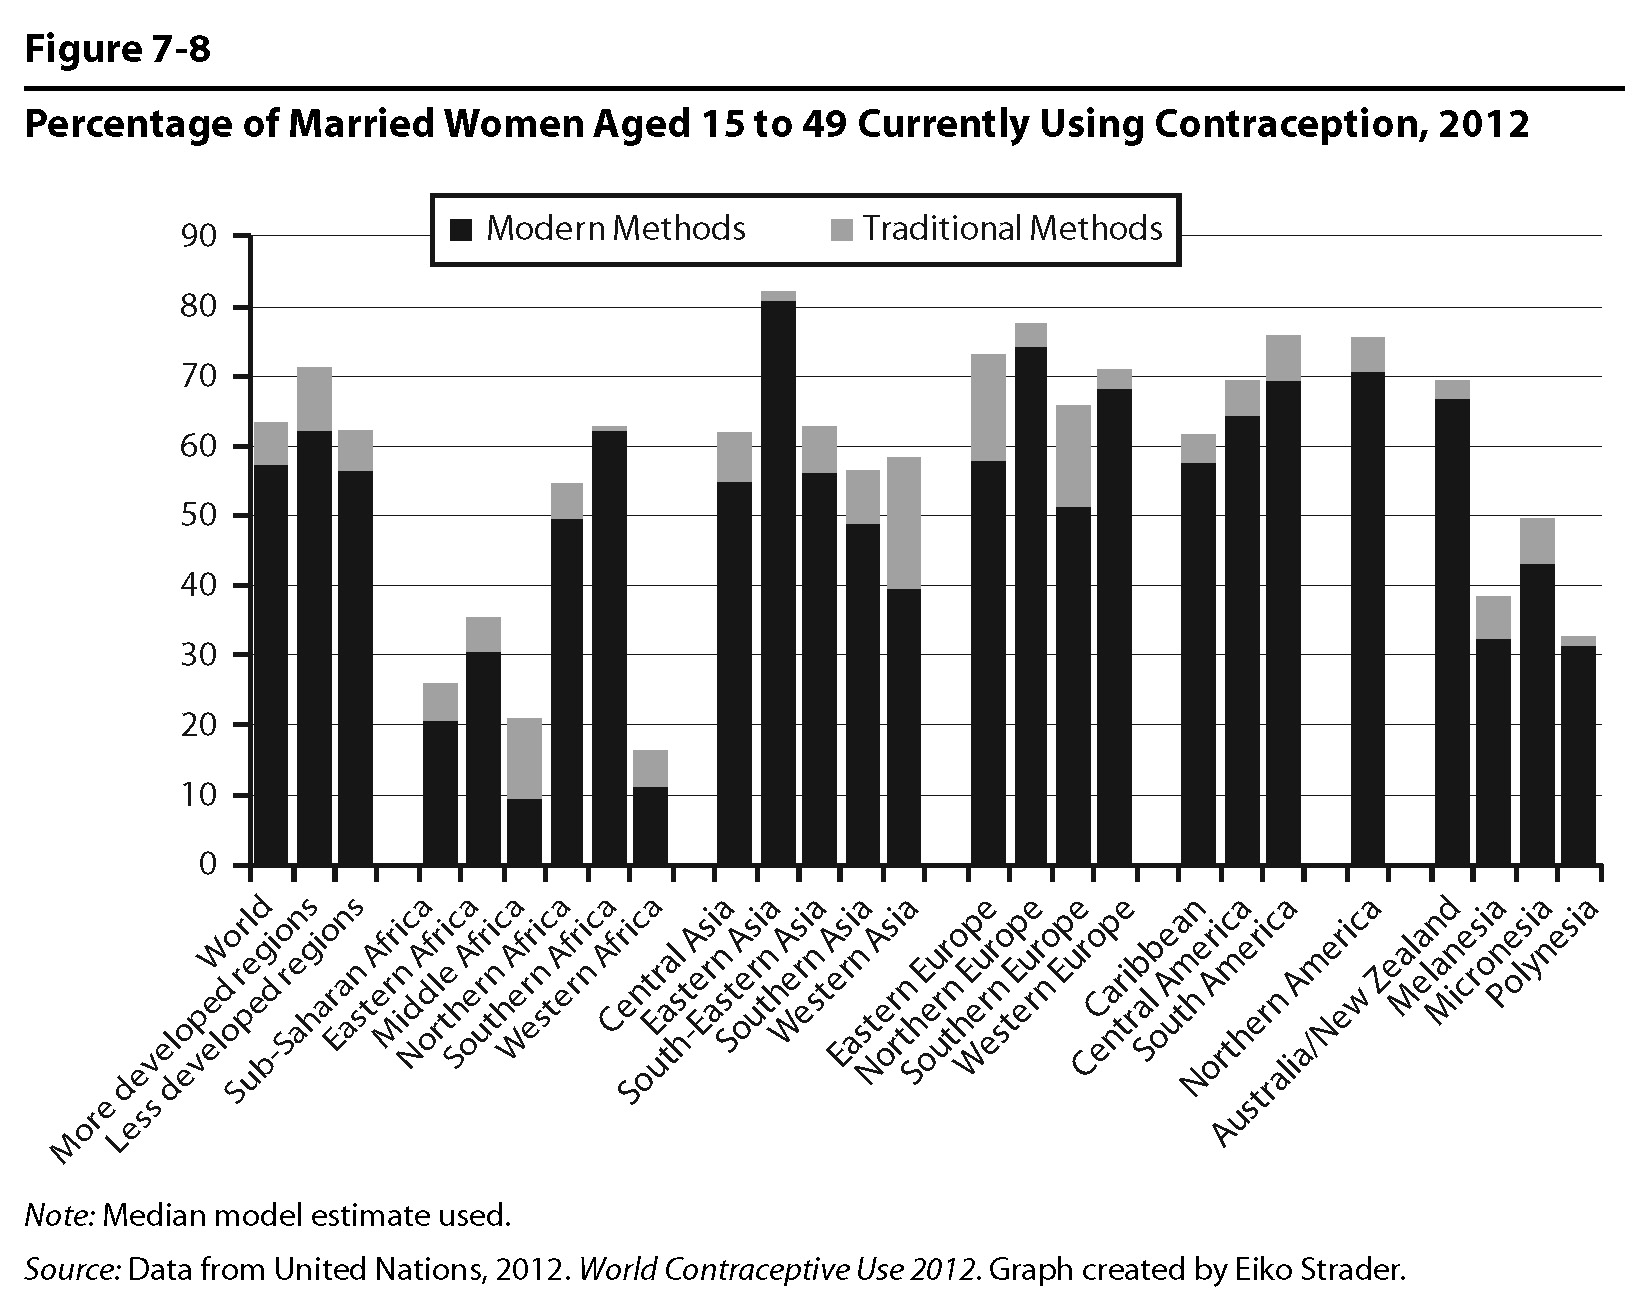
Figure 7.8