Chapter 4: Age and Sex Structure
Exercise 1
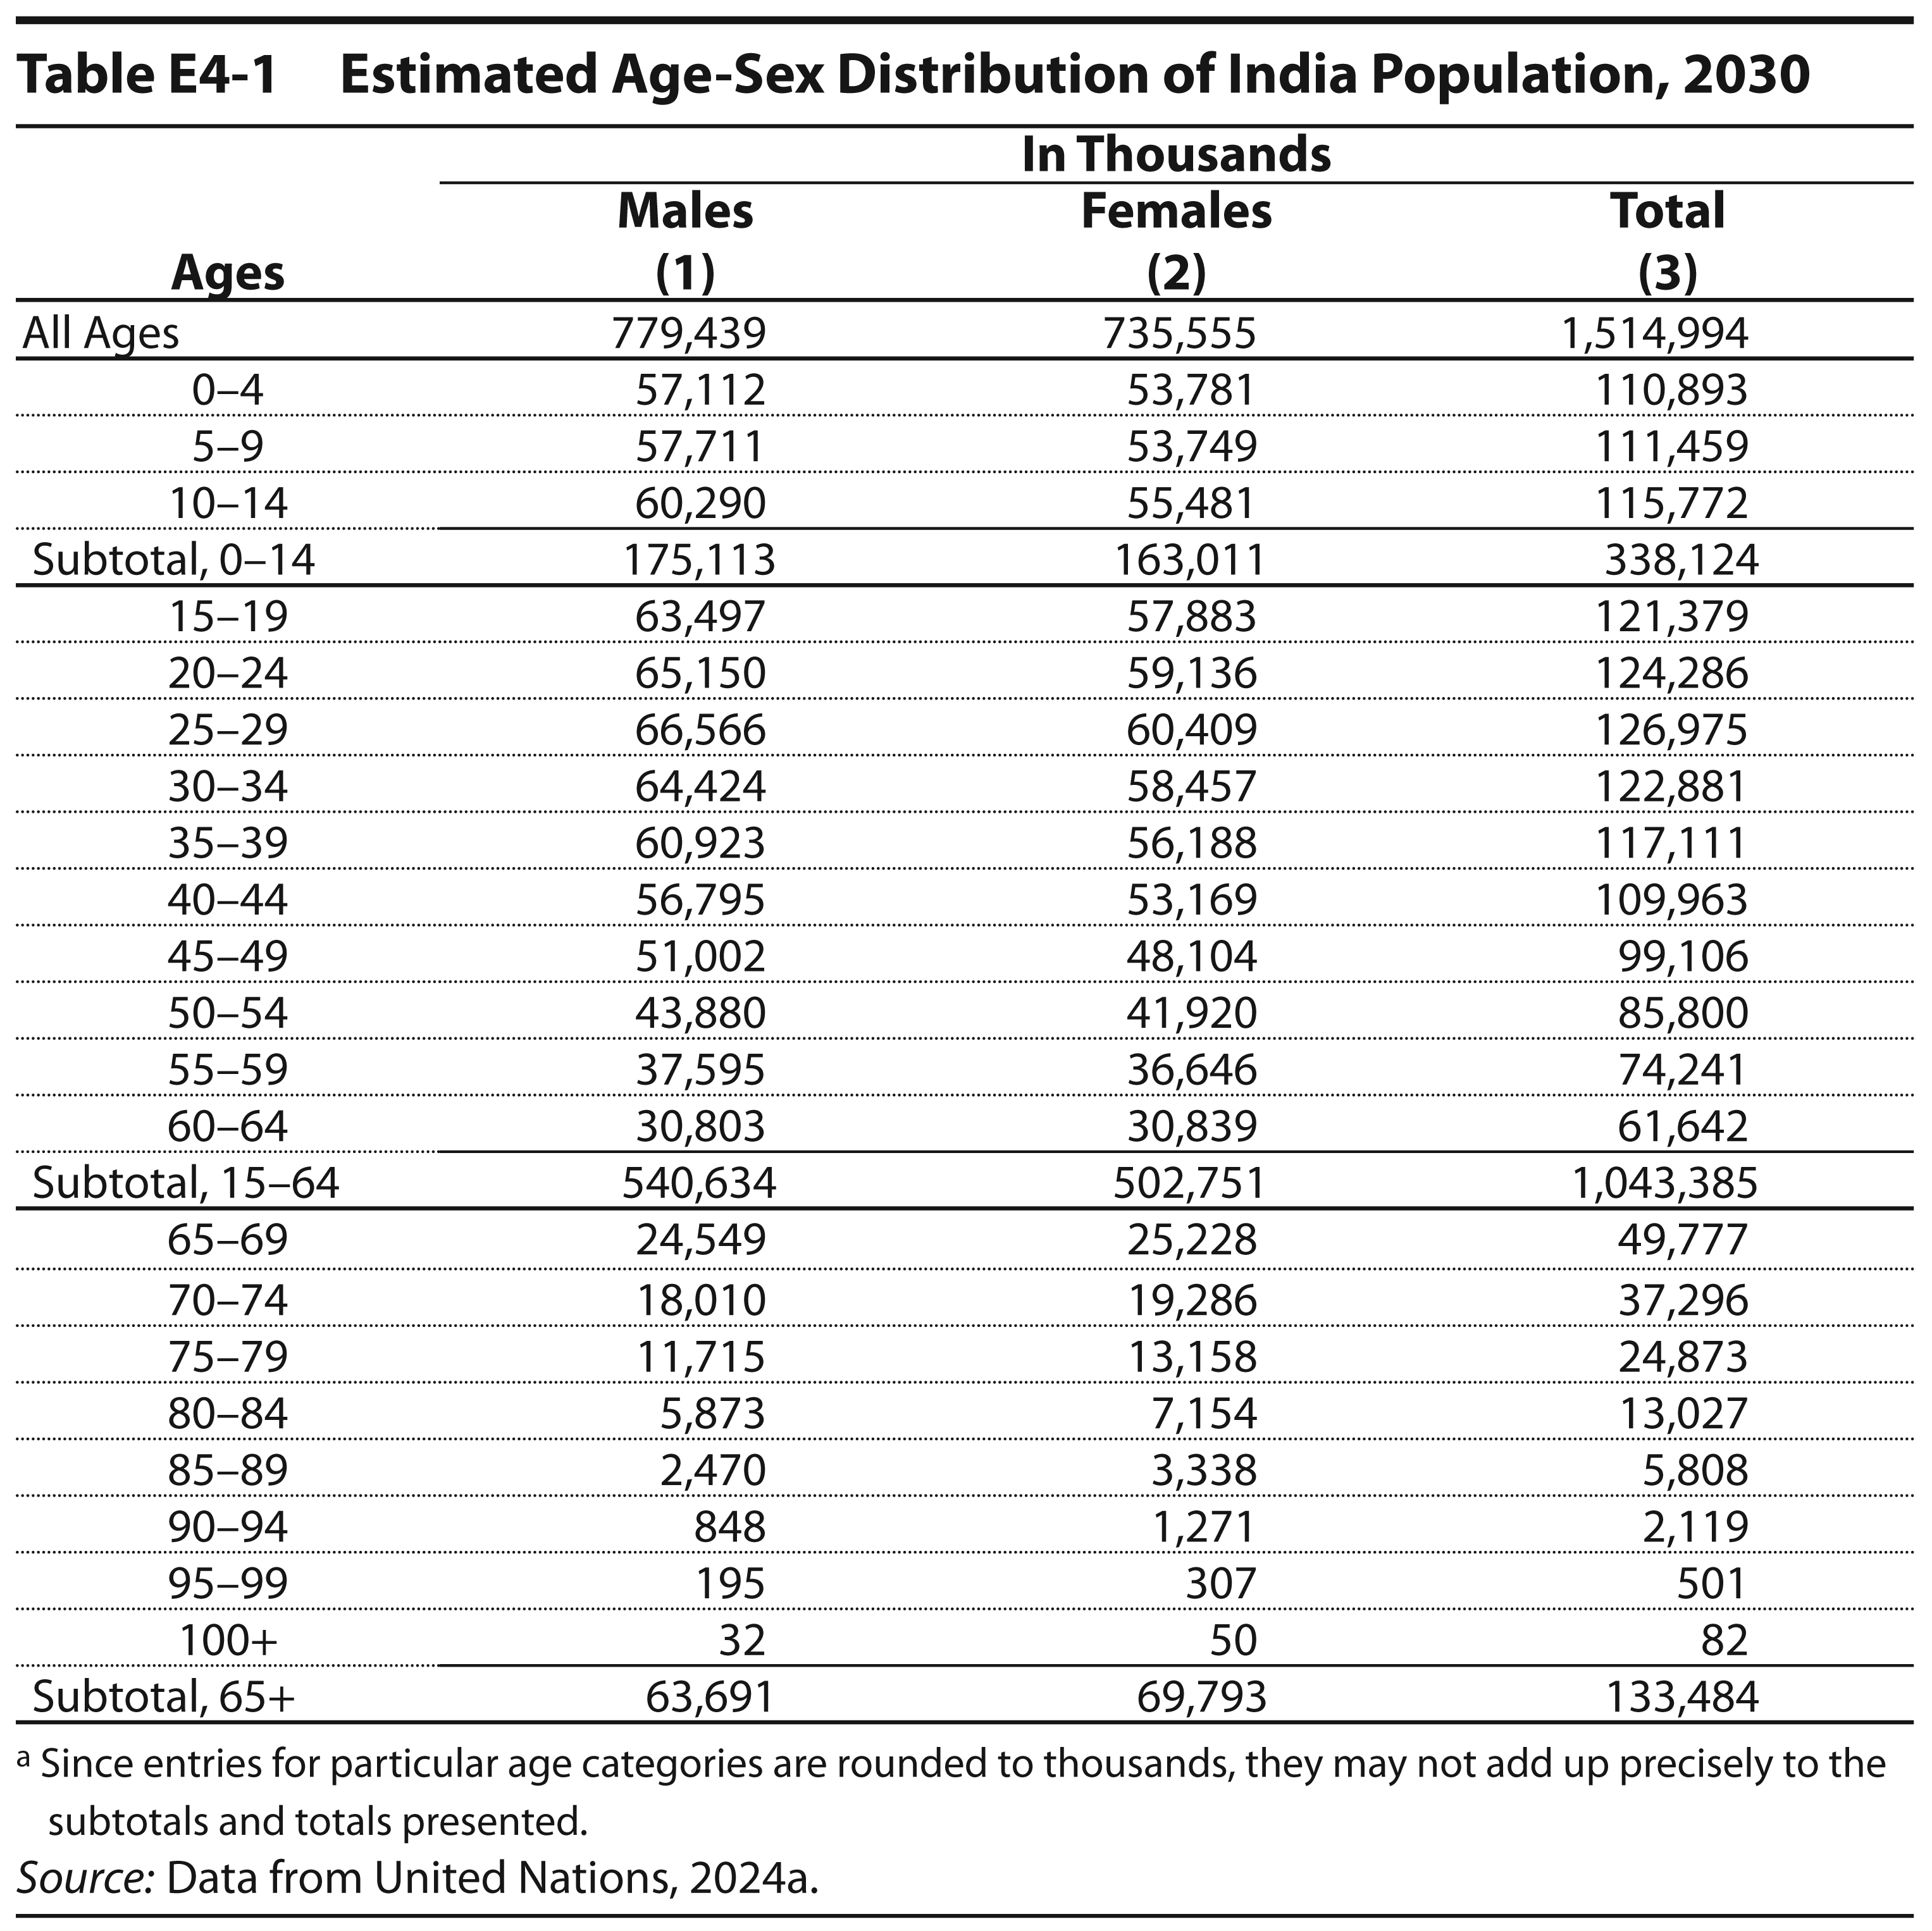
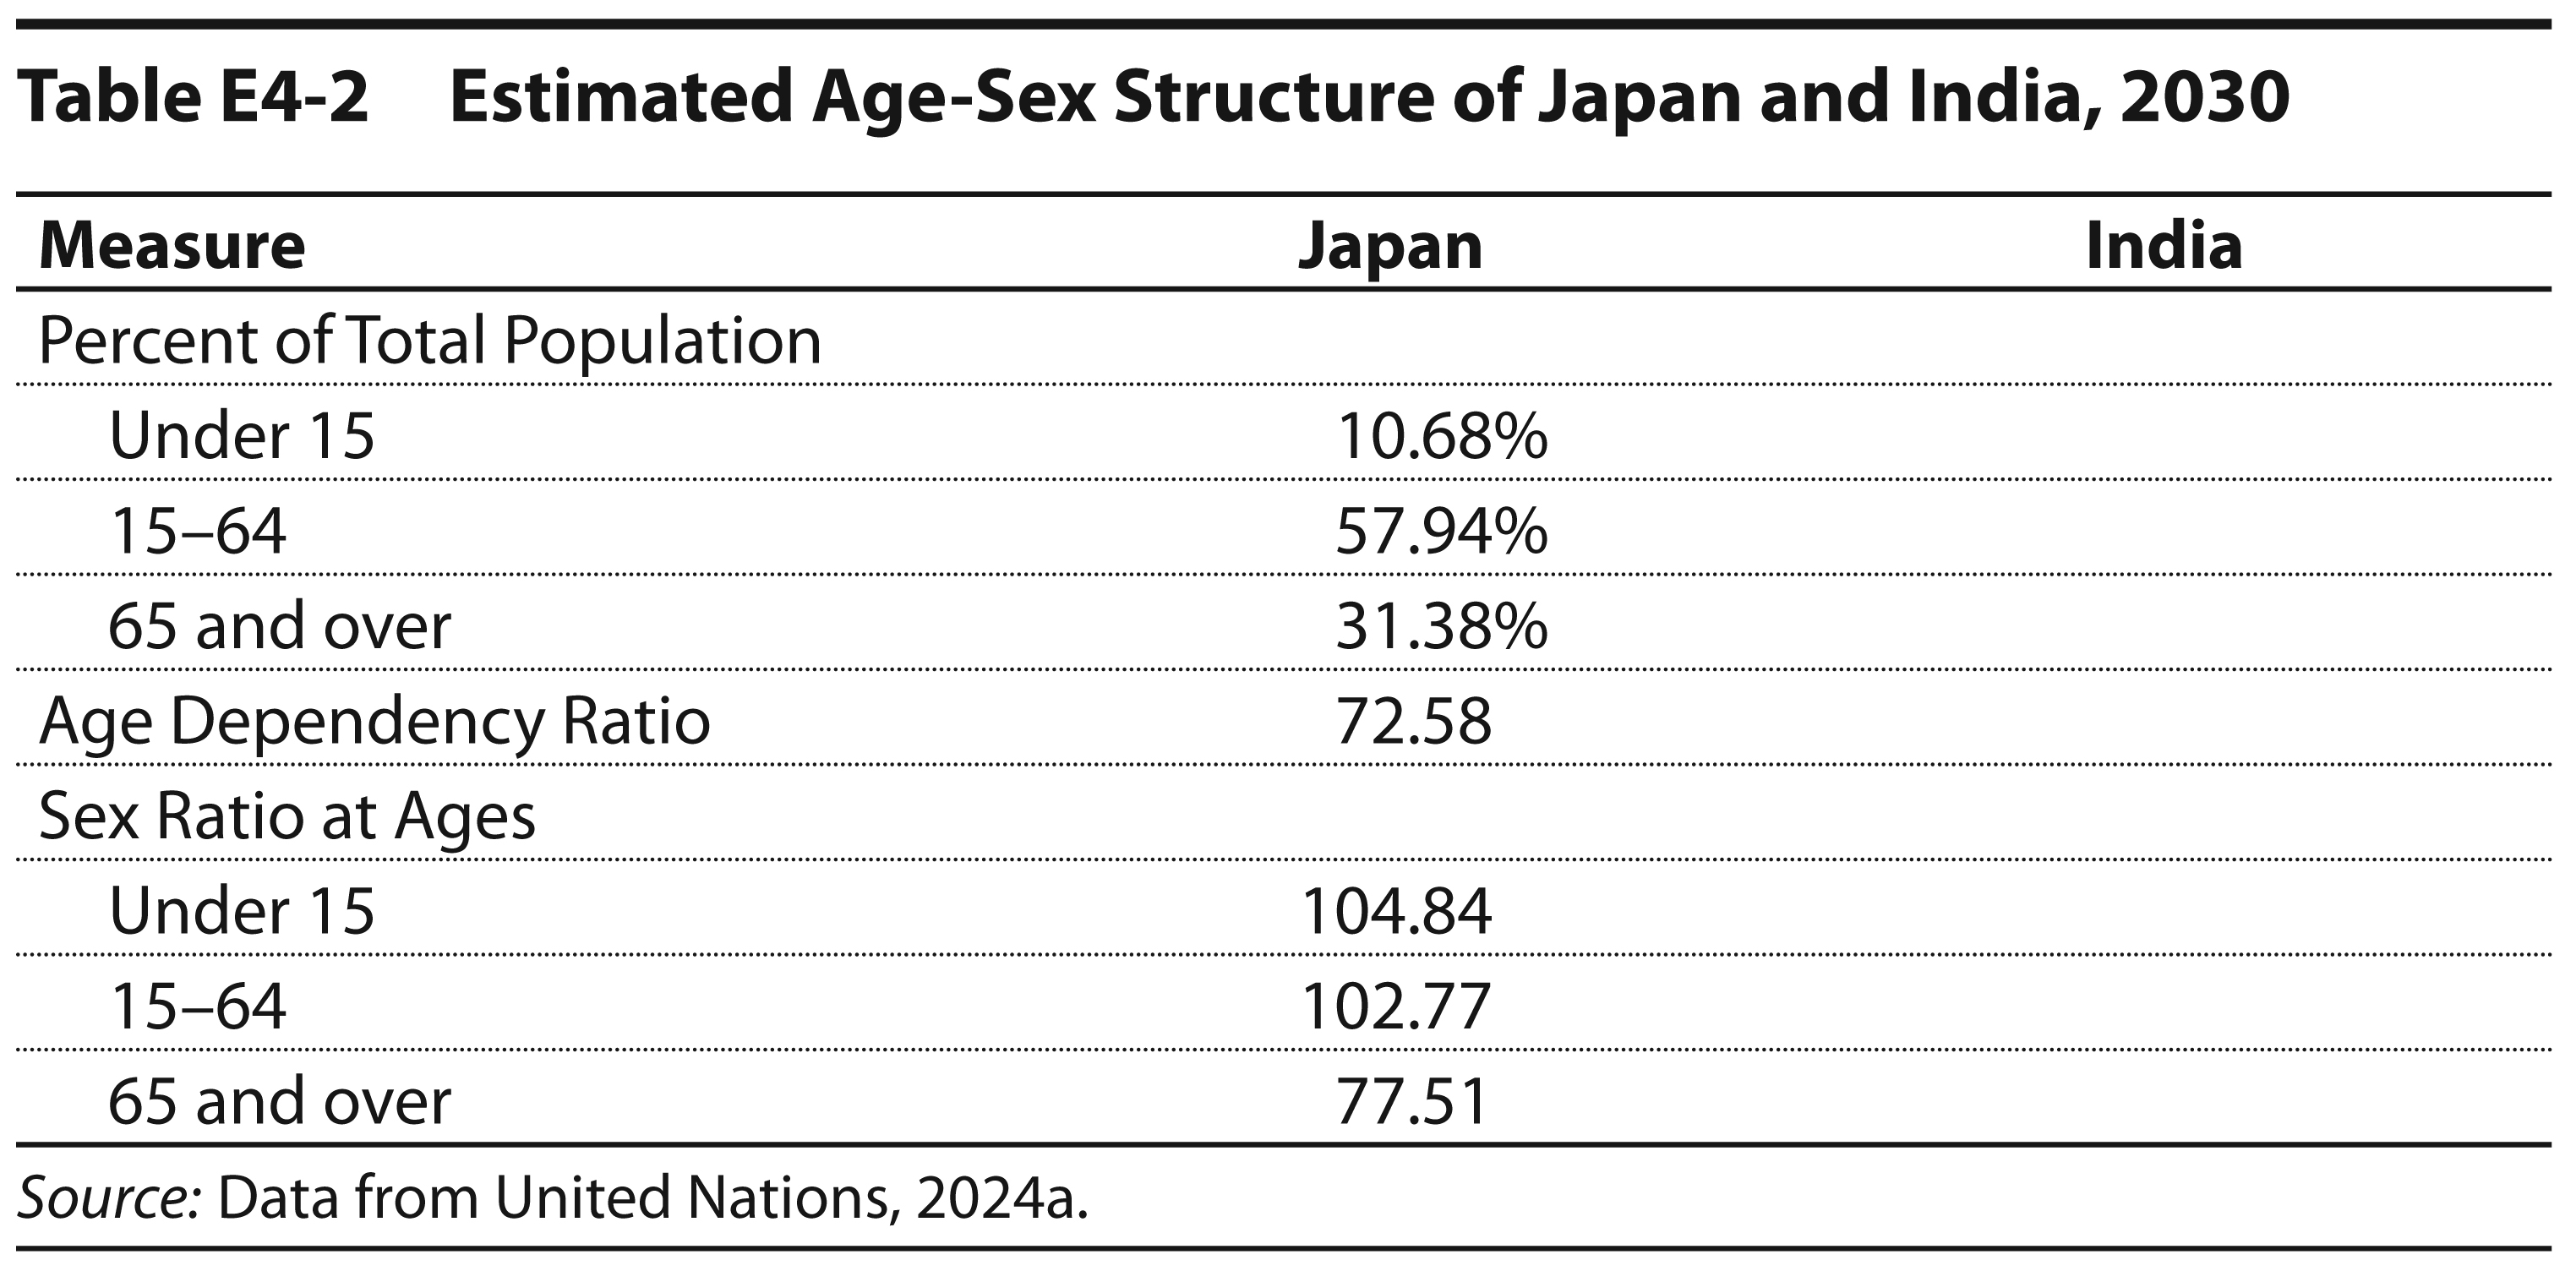
Table E4-1 presents age frequency distributions for the 2030 population of India for men, women, and for both sexes together. Using these data, complete exercises a, b, and c by filling in the cells in the India column of Table E4-2. We have computed the statistics for Japan’s population as a comparison.
- a. Compute the percentages of both sexes combined under fifteen years of age, fifteen through sixty-four, and sixty-five years and over. Round the percentages to two decimal places and enter these percentages in the spaces provided in Table E4-2.
-
b.
Compute the sex ratios for each of the three age categories, round to two decimal places, and enter in the spaces provided in Table E4-2. The formula for the sex ratio is:
Men Women× 100
-
c.
Compute the age-dependency ratio for both sexes together, round to one decimal place, and enter in the space provided in Table E4-2. The formula for the age-dependency ratio is:
P0–14 + P65+ P15–64× 100
- d. Describe how the two populations differ in terms of their dependency and sex ratios.
Exercise 2
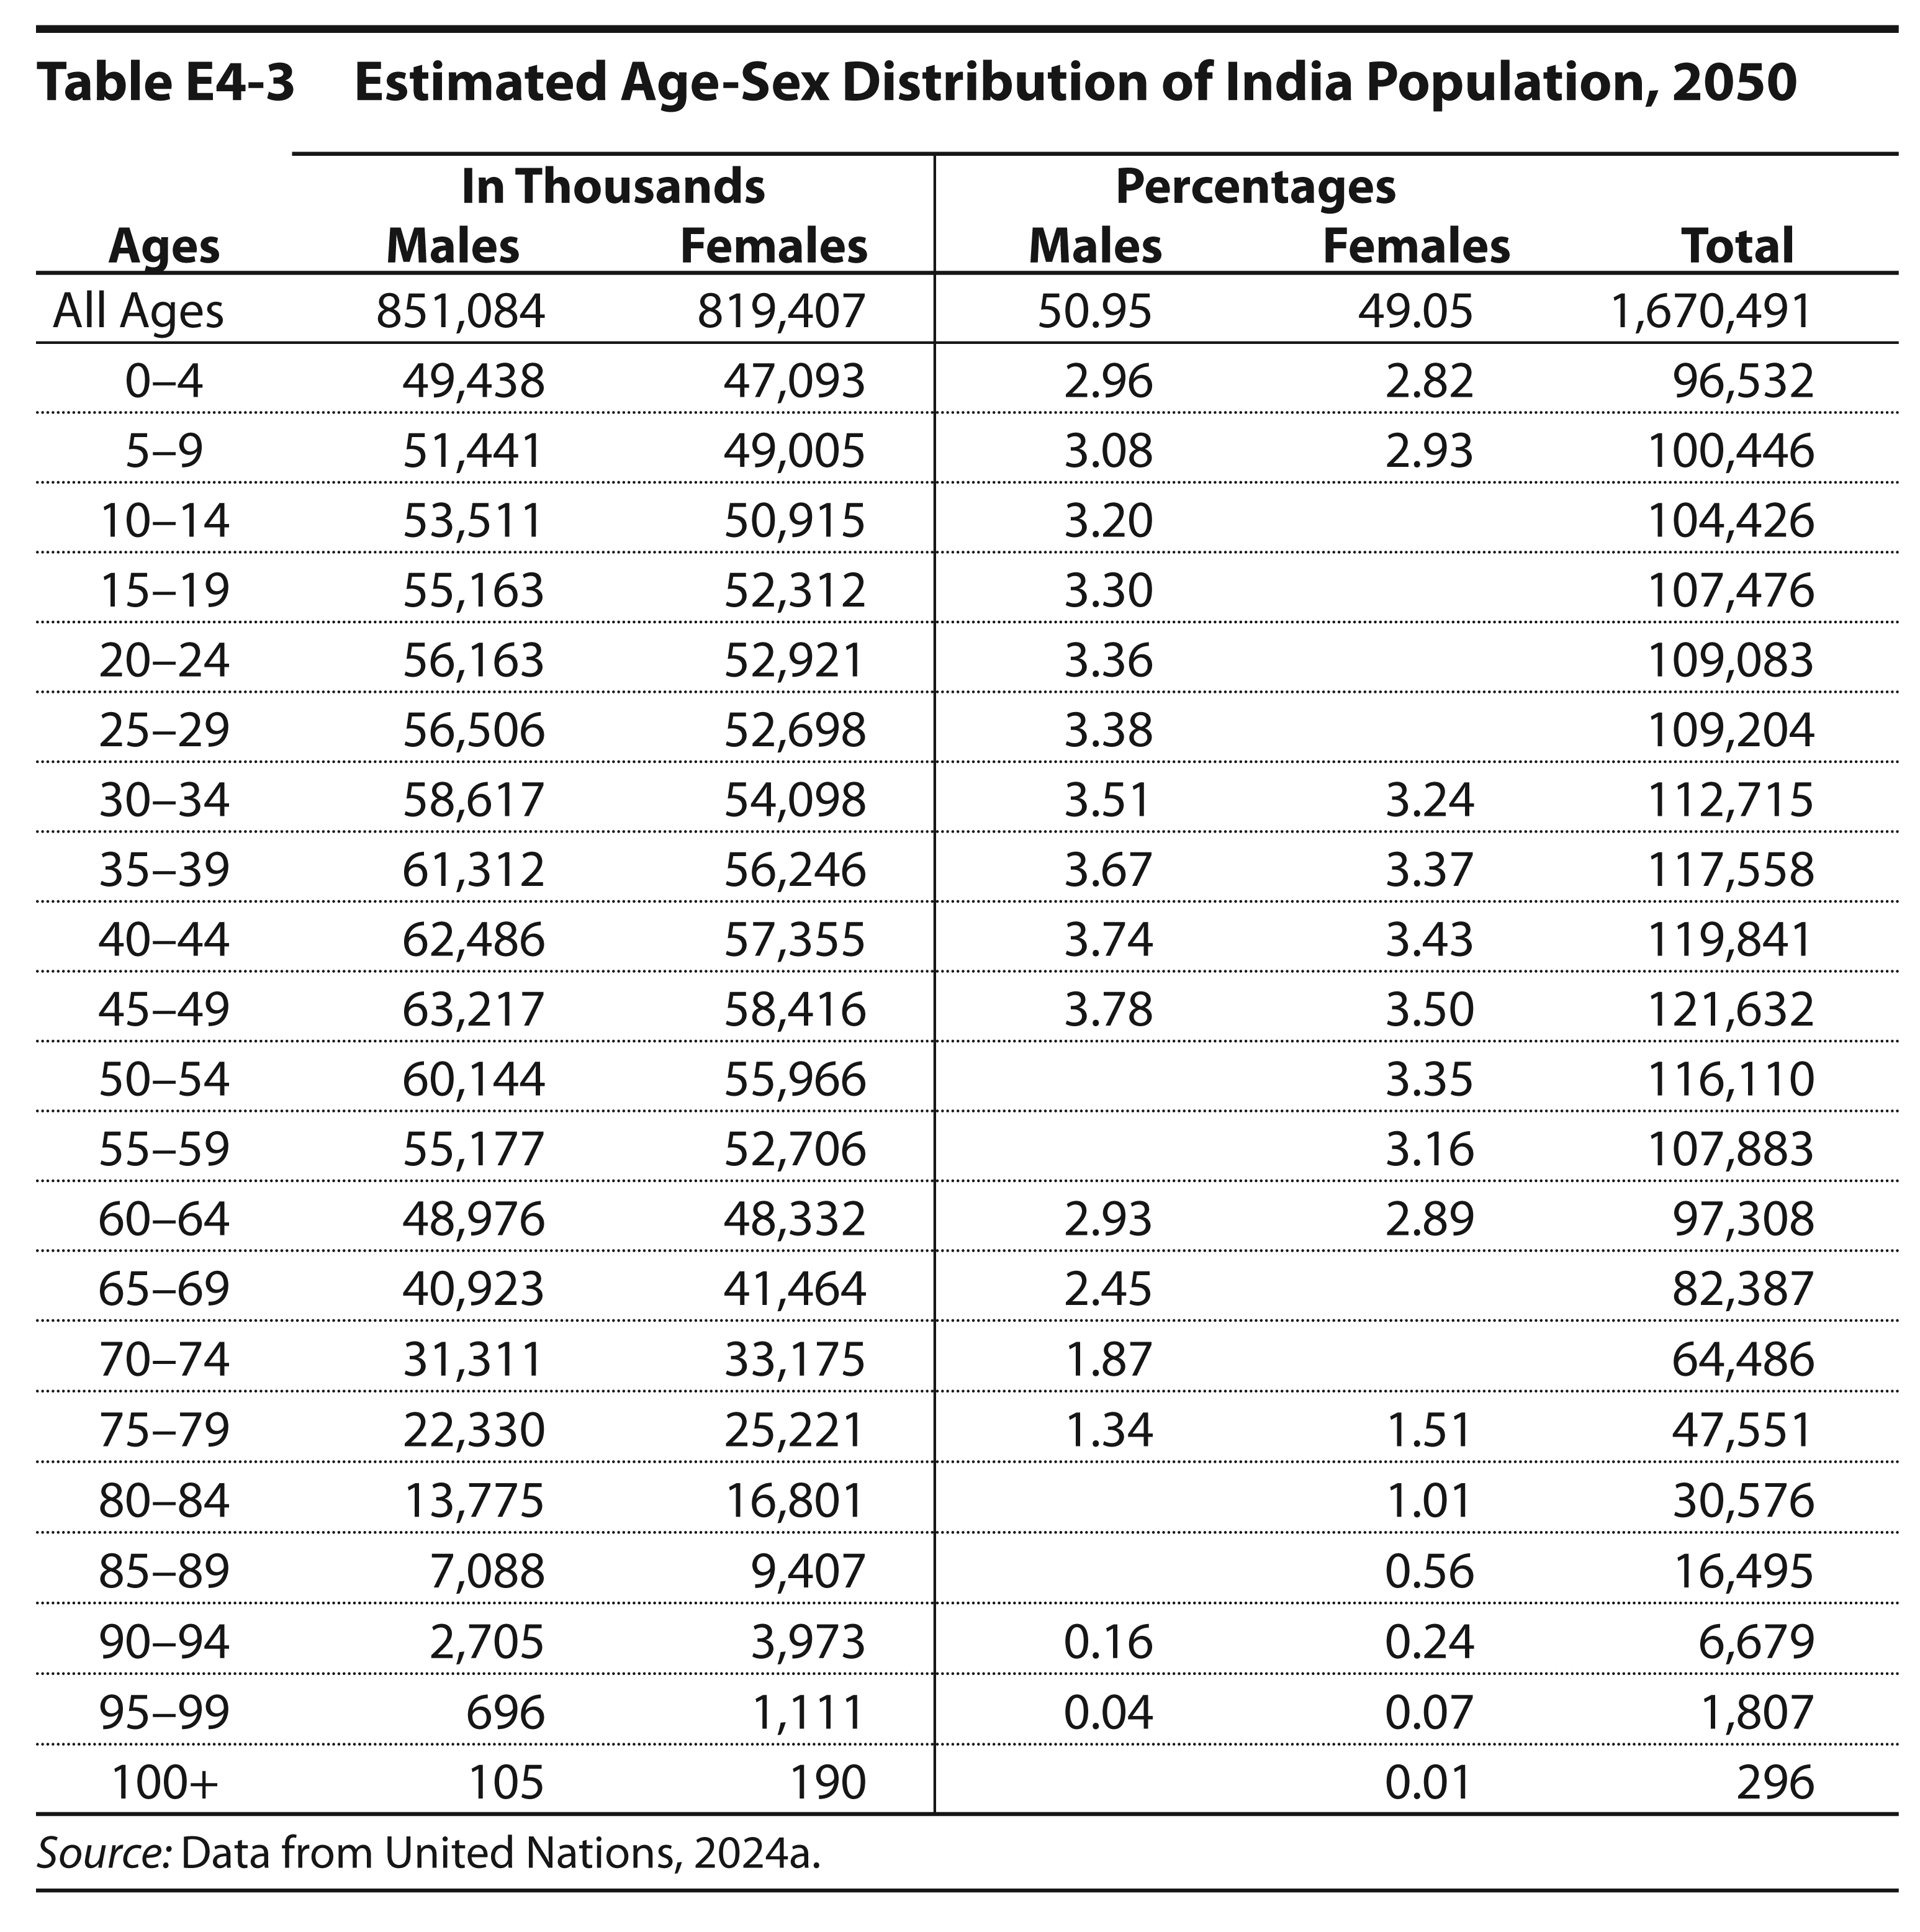
Table E4-3 classifies the projected population of India for 2050 by age and sex. Construct a population pyramid from these data, taking the following steps:
- a. In the columns provided, enter the missing percentages. Remember that these percentages have as their denominators the total population of both sexes.
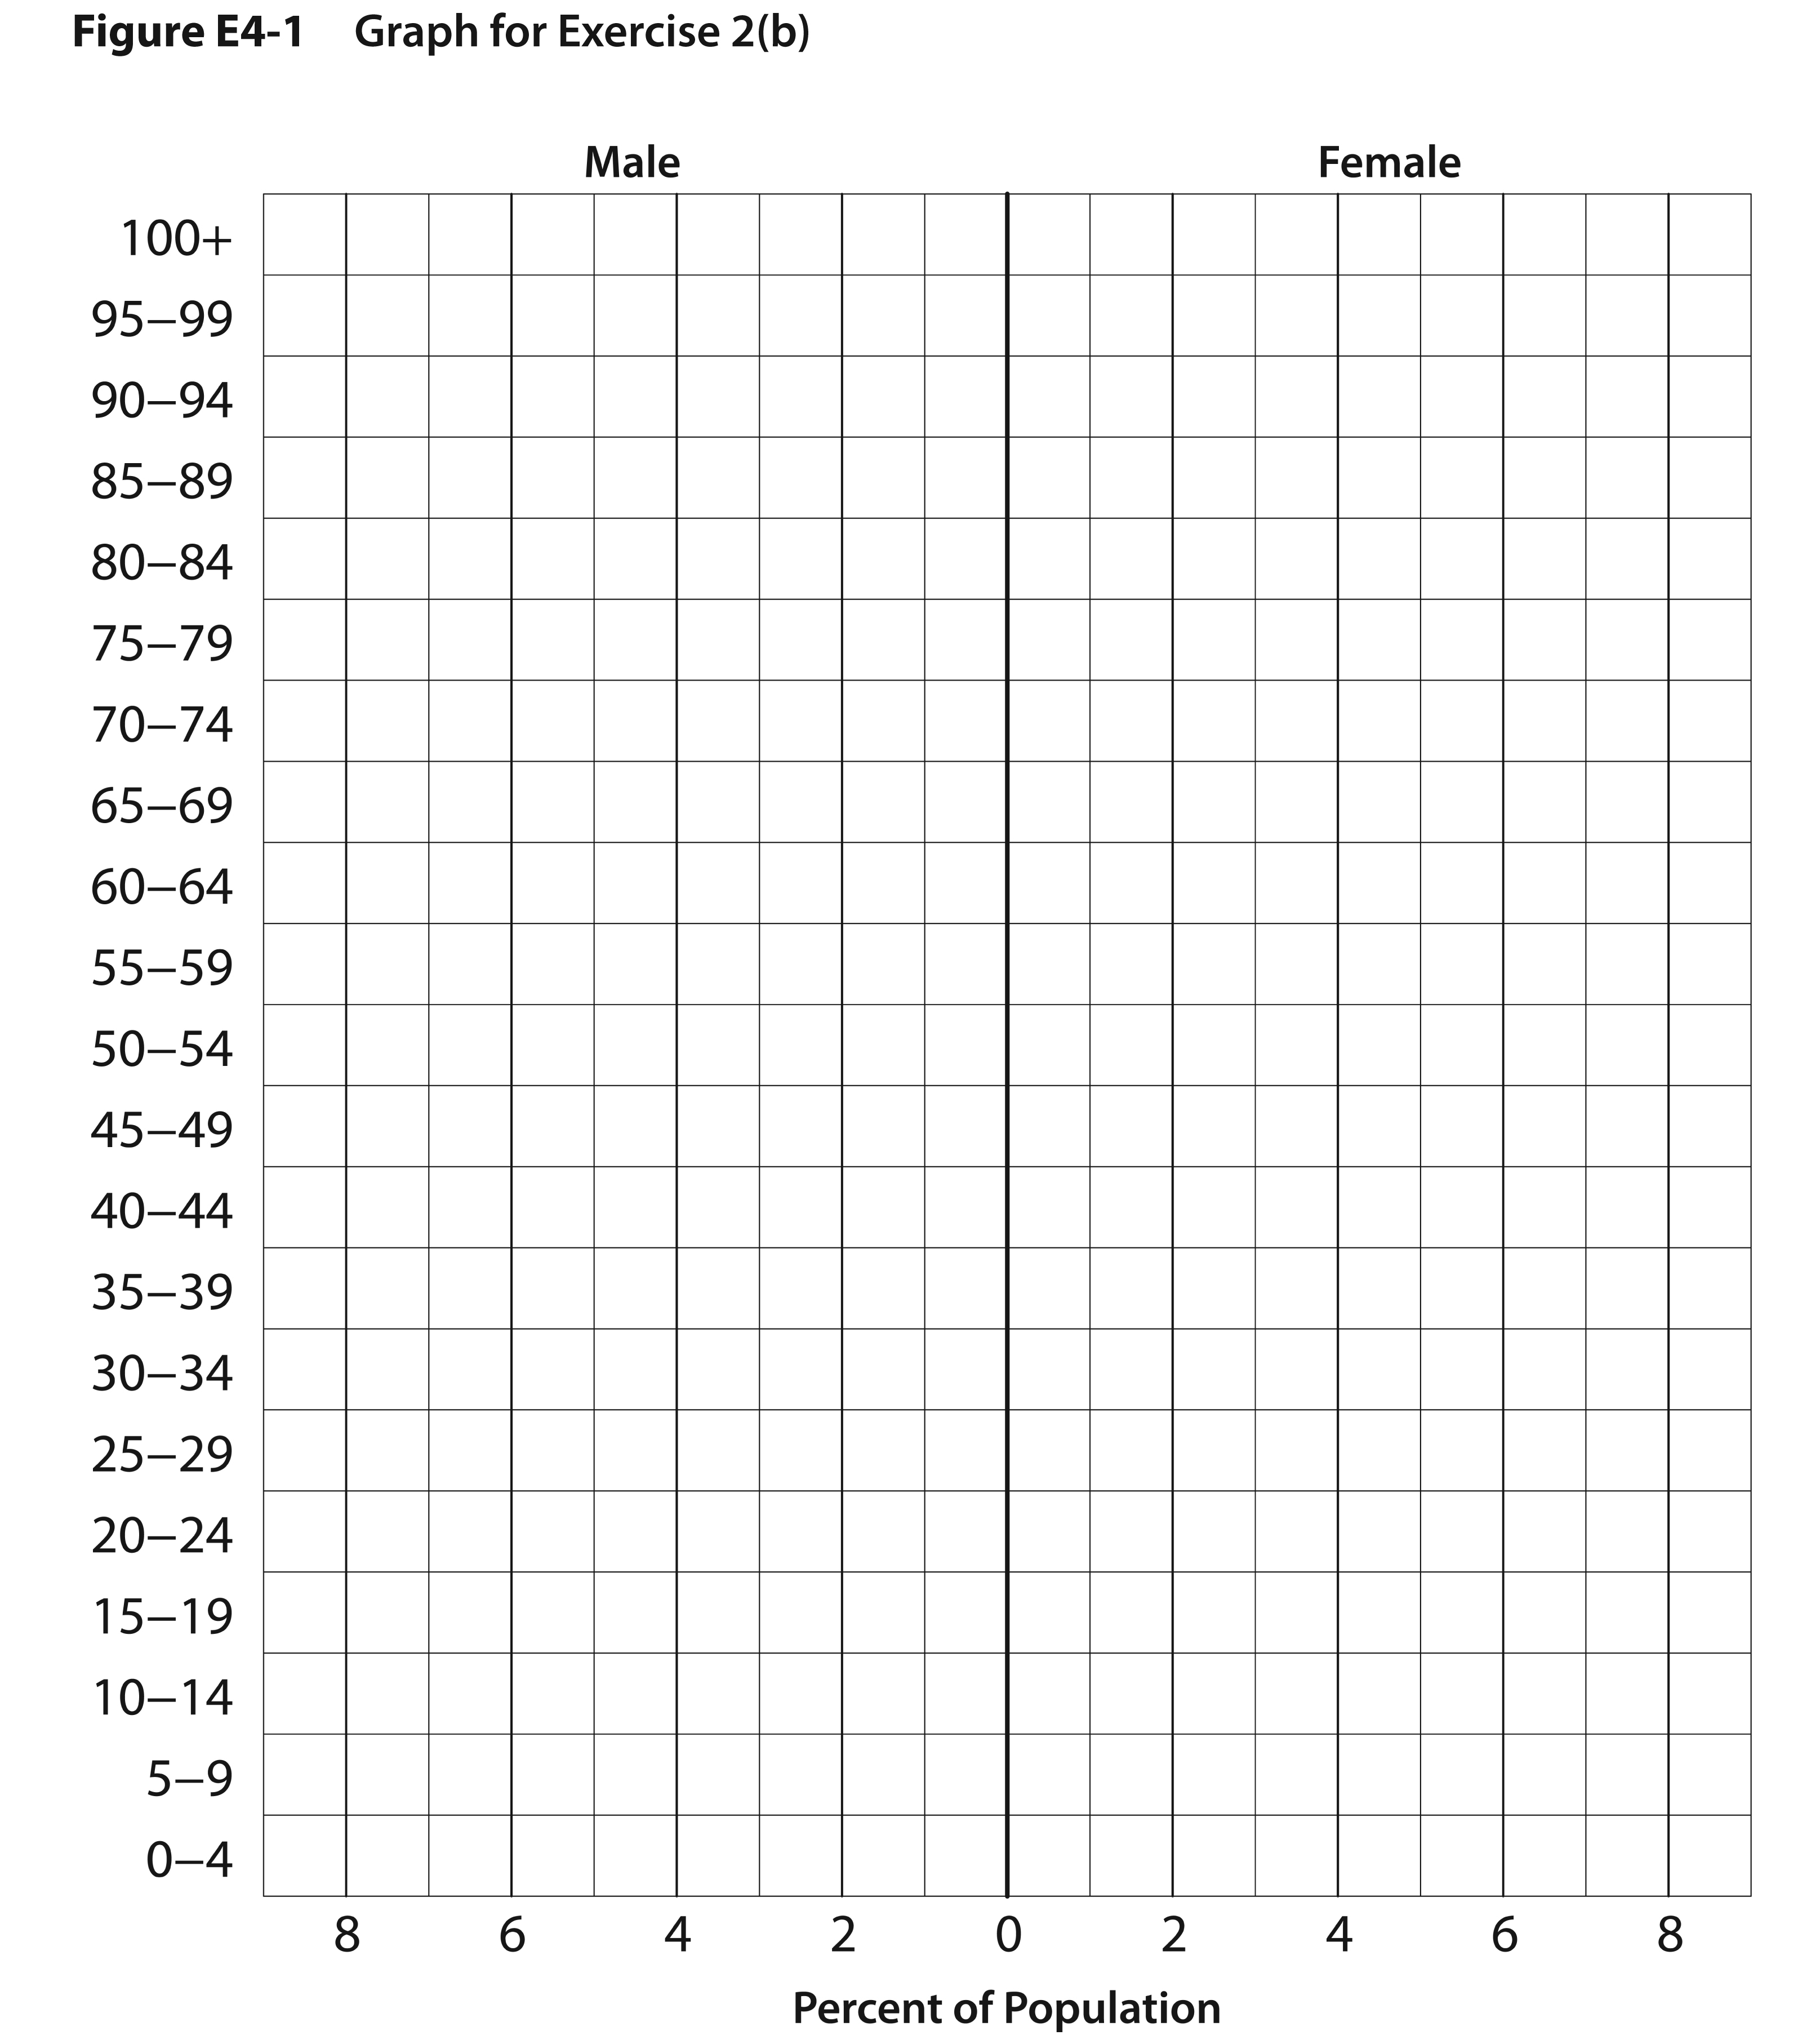
- b. On Figure E4-1, draw a population pyramid, using the percentages in columns 3 and 4. Shade the area within the pyramid. Alternatively, you can construct the pyramid in a spreadsheet by modifying a stacked bar chart as follows: Statology Guide.
Exercise 3
- ______ younger
- ______ older
- ______ the same
- ______ younger
- ______ older
- ______ the same
Exercise 4
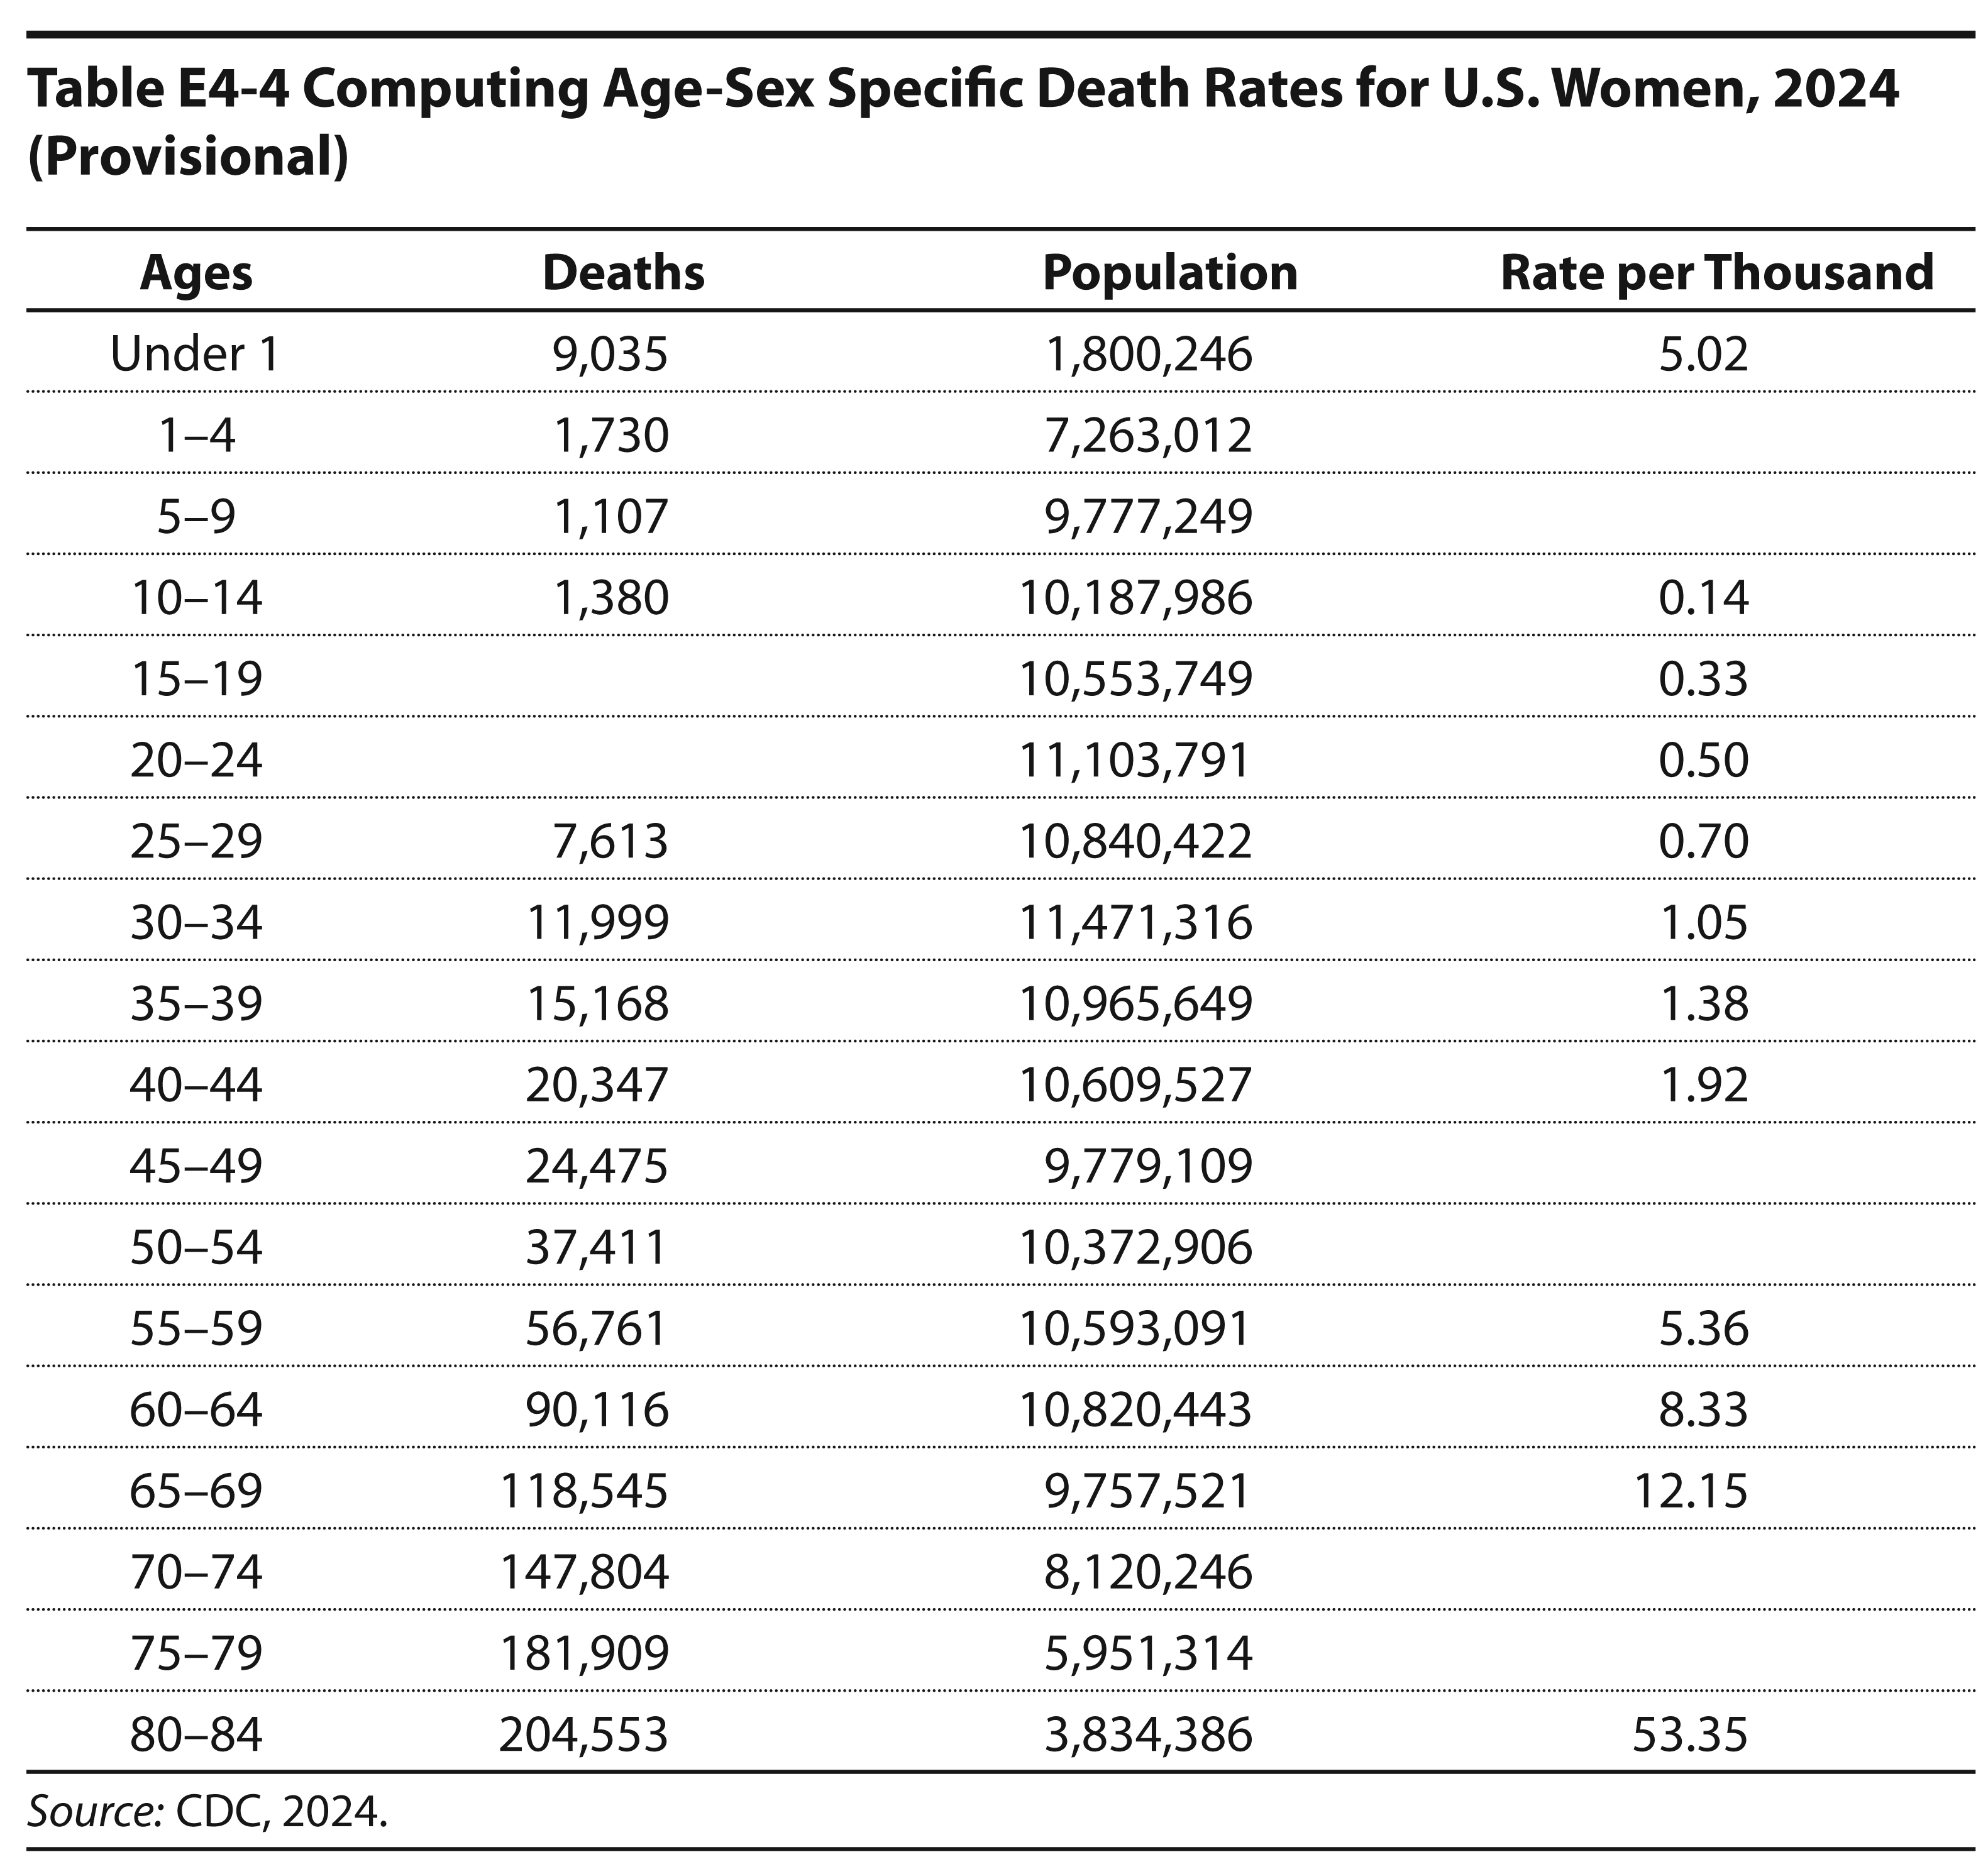
Practice constructing age-sex-specific rates for death. Table E4-4 presents the data for U.S. women in 2024. For each age category, column 1 tells how many women of that age died in 2024, column 2 tells the estimated number of total women of that age, and column 3 tells the age-sex-specific death rate (per thousand women). Thus, to get the death rate for the under age 1 row, the 9,035 deaths were divided by the 1,800,246 girl babies born in that year and then multiplied by 1,000, producing a death rate of 5.02 deaths per thousand girls under 1. Compute rates for the rows where rates have been omitted. (Refer to Box 4-2 for an explanation of age-sex-specific rates.)
- a. Why are deaths rates higher in the age 0–1 category than in the age categories that follow it?
- b. How might these rates look different if they were for men instead of women?