Chapter 10: Urbanization
Exercise 1
Watch this documentary on global cities and summarize the main takeaways.
Exercise 2
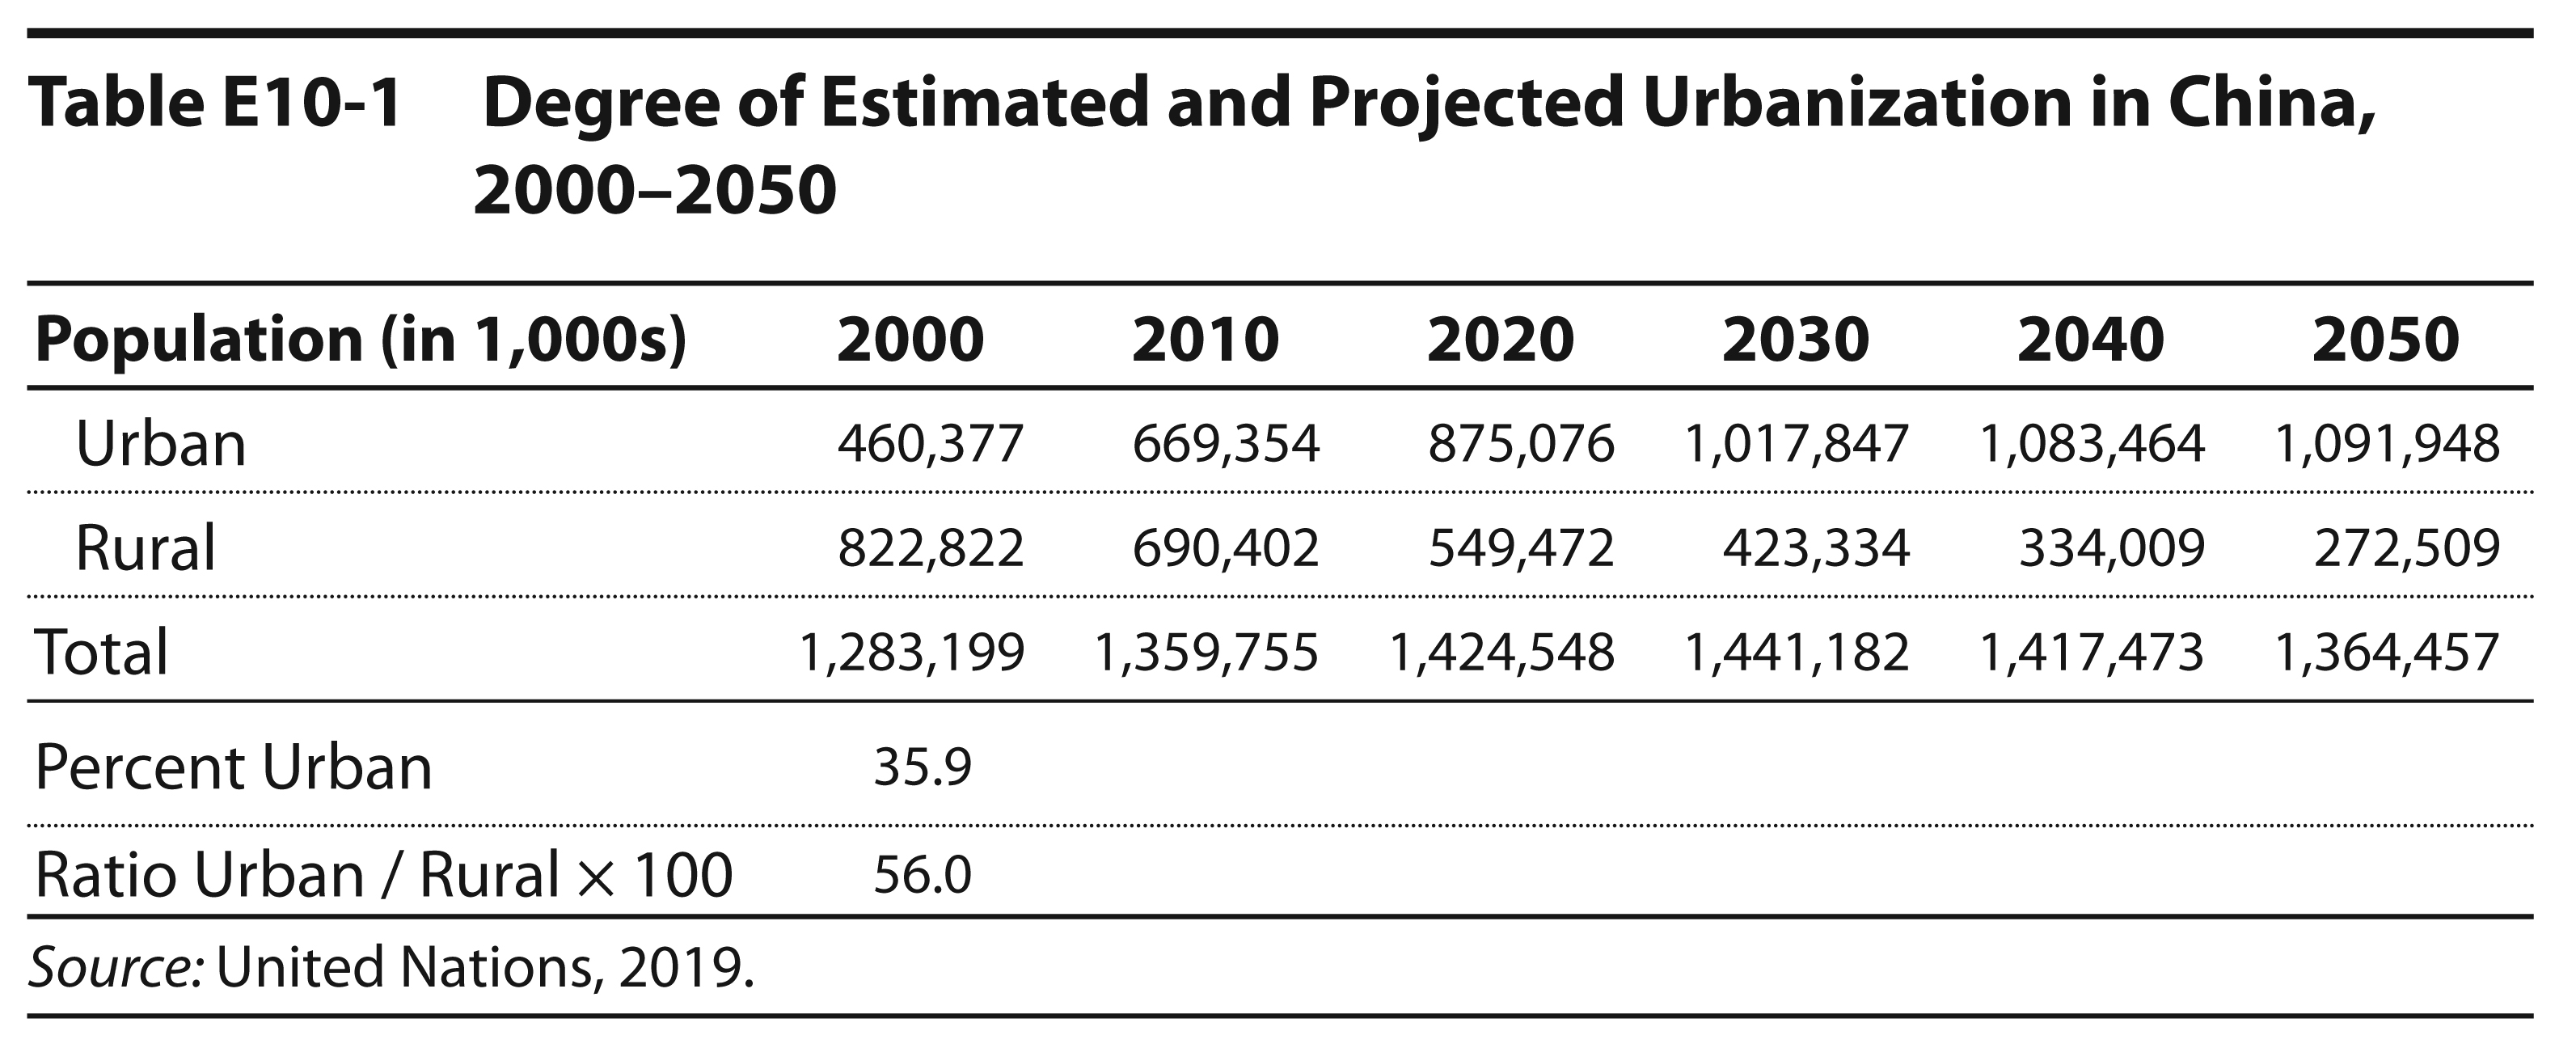
Compute measures of the degree of urbanization in China, using the data and examples in Table E10-1.
a. Percent urban: For each year from 2010 through 2050, calculate the percentage of China’s total population living in urban areas, rounding to one decimal place, and record them in the five blank spaces of the table.
b. Compute the ratio of the urban population to the rural population for 2010 through 2050, rounding to one decimal place, and record them in the five blank spaces in the table. Based on the table, during which decade did China become majority urban?
Exercise 3
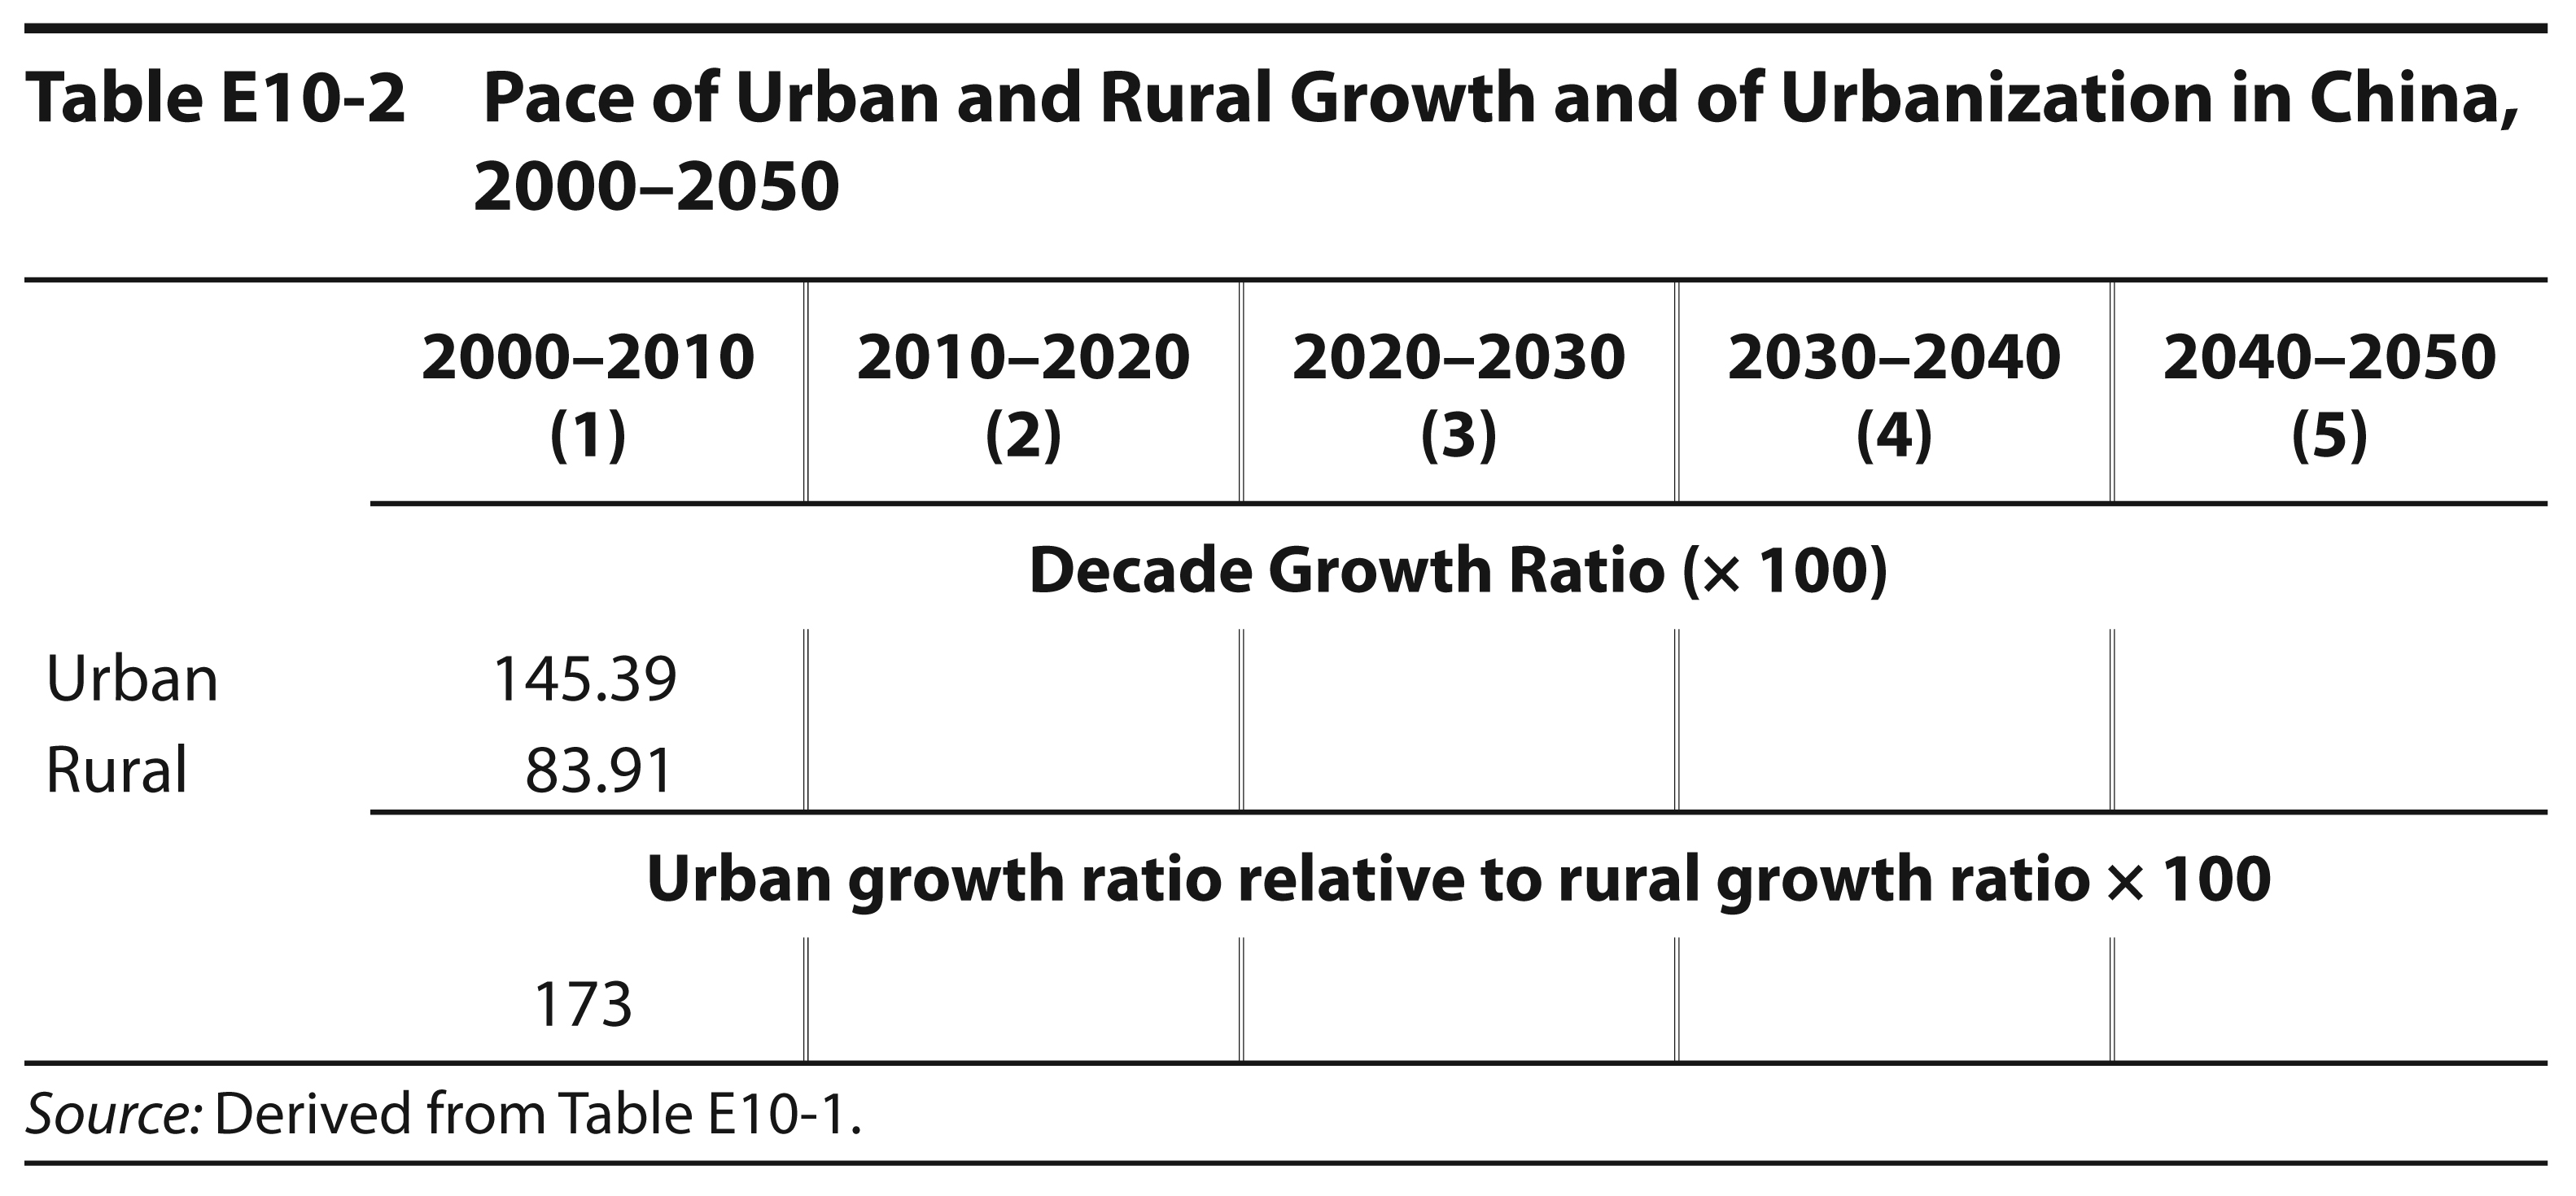
Compute measures of the pace of Chinese urban growth and of urbanization, using the data in Table E10-1 and examples in Table E10-2.
a. Compute ratios of urban growth for 2010–2020 through 2040–2050. Divide the urban population at the end of the decade by the urban population at the beginning of the decade, then multiply by 100. Round to one decimal place and record in the four blank spaces in Table E10-2.
b. Compute the ratios of rural growth for 2010–2020 through 2040–2050, using the same procedure. Round to one decimal place and record in the blank spaces in Table E10-2.
c. Compute the ratio of the urban-growth ratio to the rural-growth ratio for 2010–2020 through 2040–2050. Multiply by 100, round to the nearest whole number, and record in the blank spaces of Table E10-2. This is one measure of the pace of urbanization.
d. If the figure in the bottom row for a given decade were less than 100, that would mean that (check one):
_____ the urban growth ratio was less than the rural growth ratio.
_____ the urban population did not grow.
_____ less than half the population lived in urban places during the decade.
_____ all of the above.
_____ the urban growth ratio was less than the rural growth ratio.
_____ the urban population did not grow.
_____ less than half the population lived in urban places during the decade.
_____ all of the above.
Exercise 4
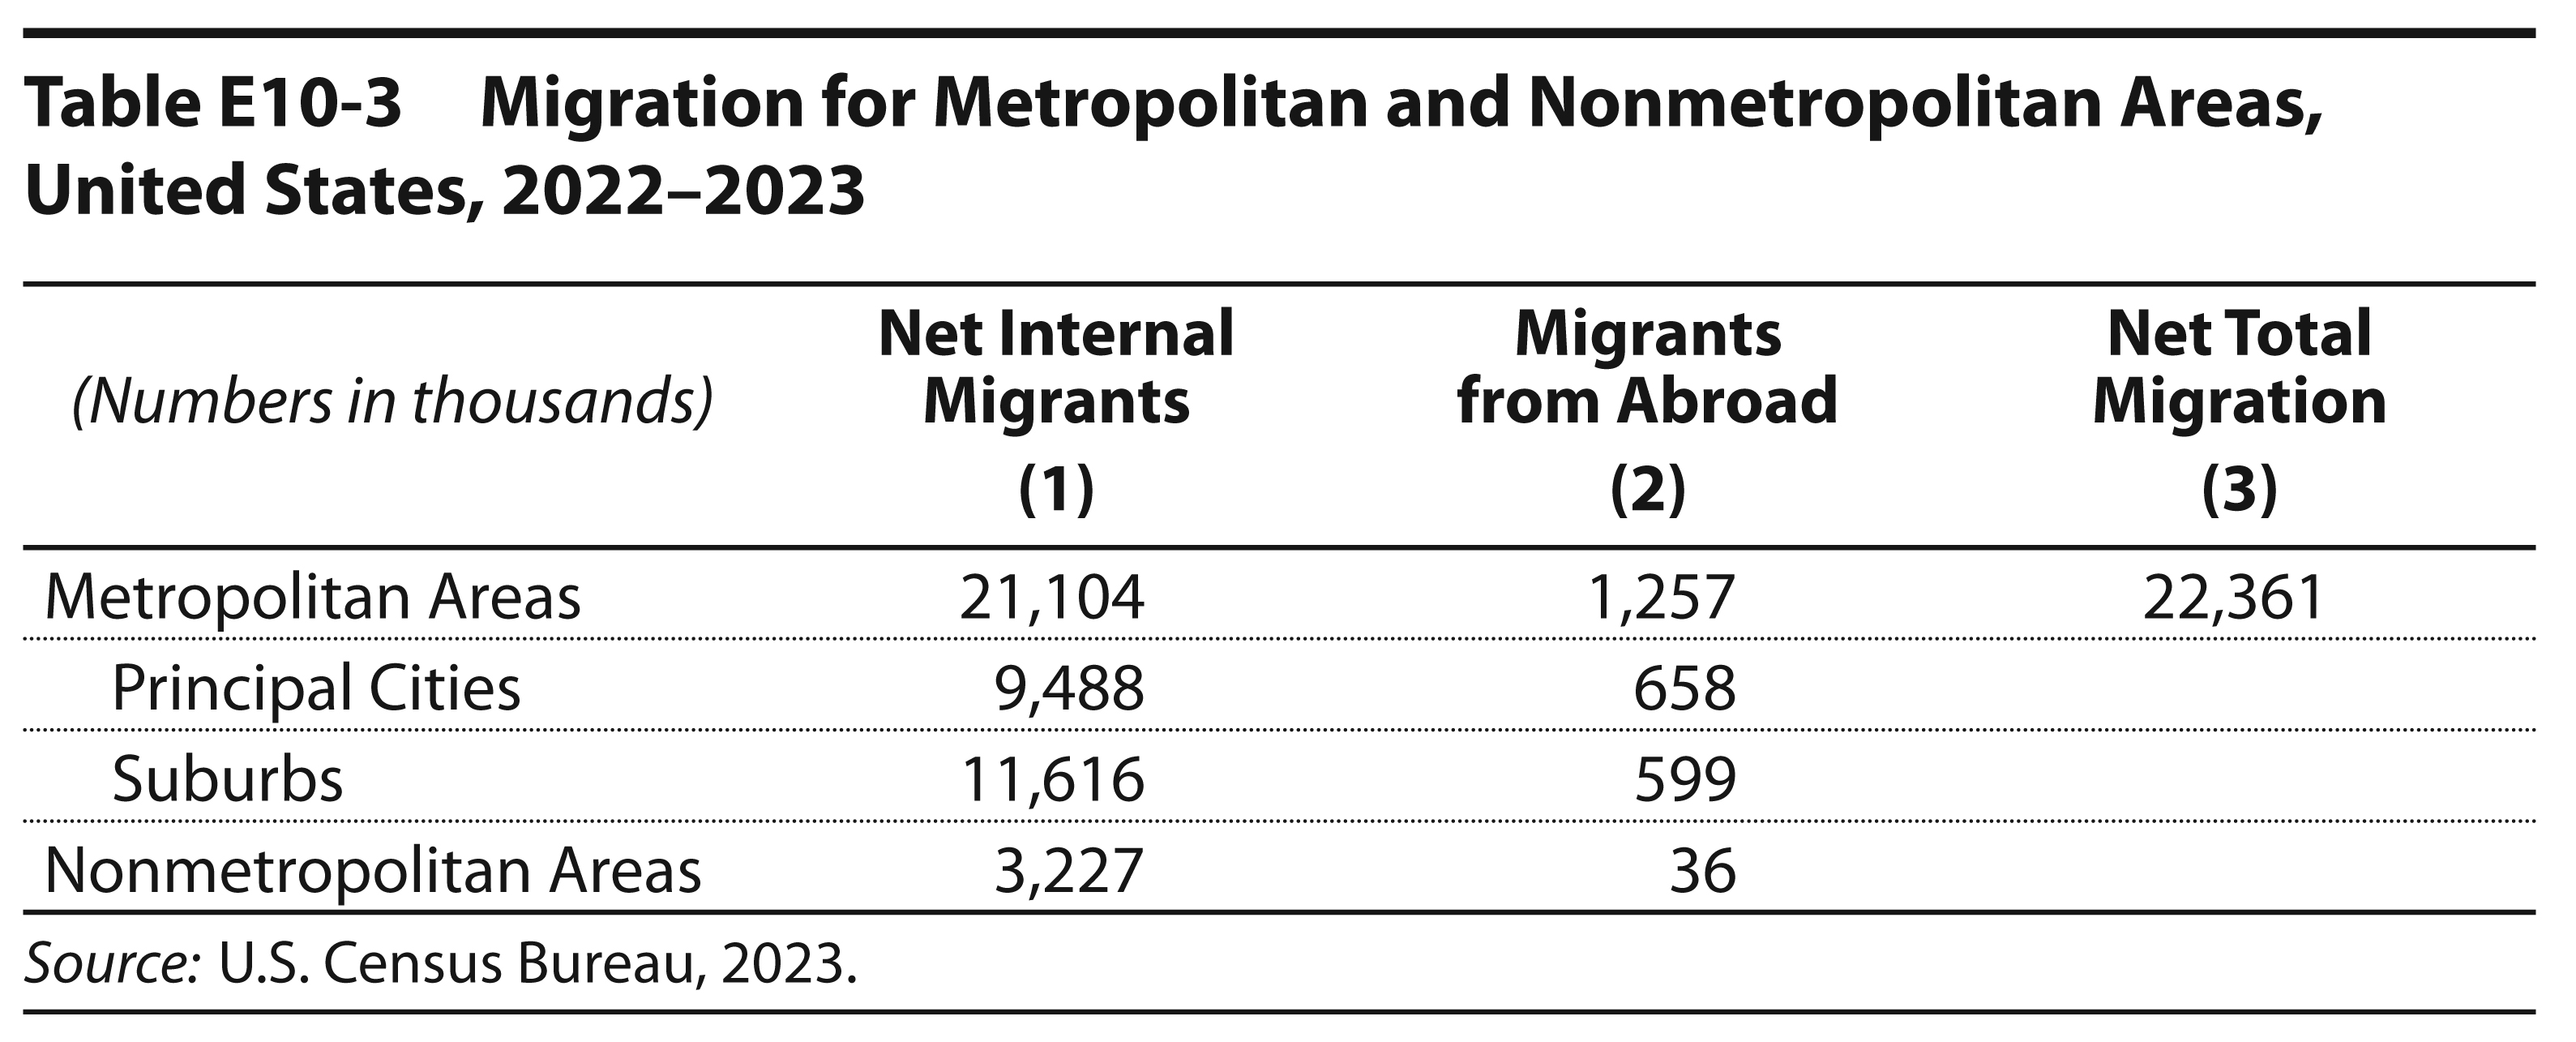
Compute net total migration for the United States between 2022 and 2023 using the data in Table E10-3. The numbers are in thousands. Metropolitan areas include both principal cities and suburbs.
a. Compute the net total migration for principal cities, suburbs, and nonmetropolitan areas in column 3 by adding net internal migrants and migrants from abroad. Enter your answers in the blank spaces of the table.
b. Among the metropolitan categories, which had the larger net total migration: principal cities or suburbs?
c. Look separately at the two types of migrants. For net internal migrants, which destination had the largest number: principal cities, suburbs, or nonmetropolitan areas? For migrants from abroad, which destination had the largest number?
d. What is the ratio of metropolitan to nonmetropolitan net migration?
e. Which type of migrant was more likely to move to a nonmetropolitan area: net internal migrants or migrants from abroad? To answer this, compare the percentage of each migrant type going to nonmetropolitan areas.