Chapter 11: Population Diversity
Exercise 1
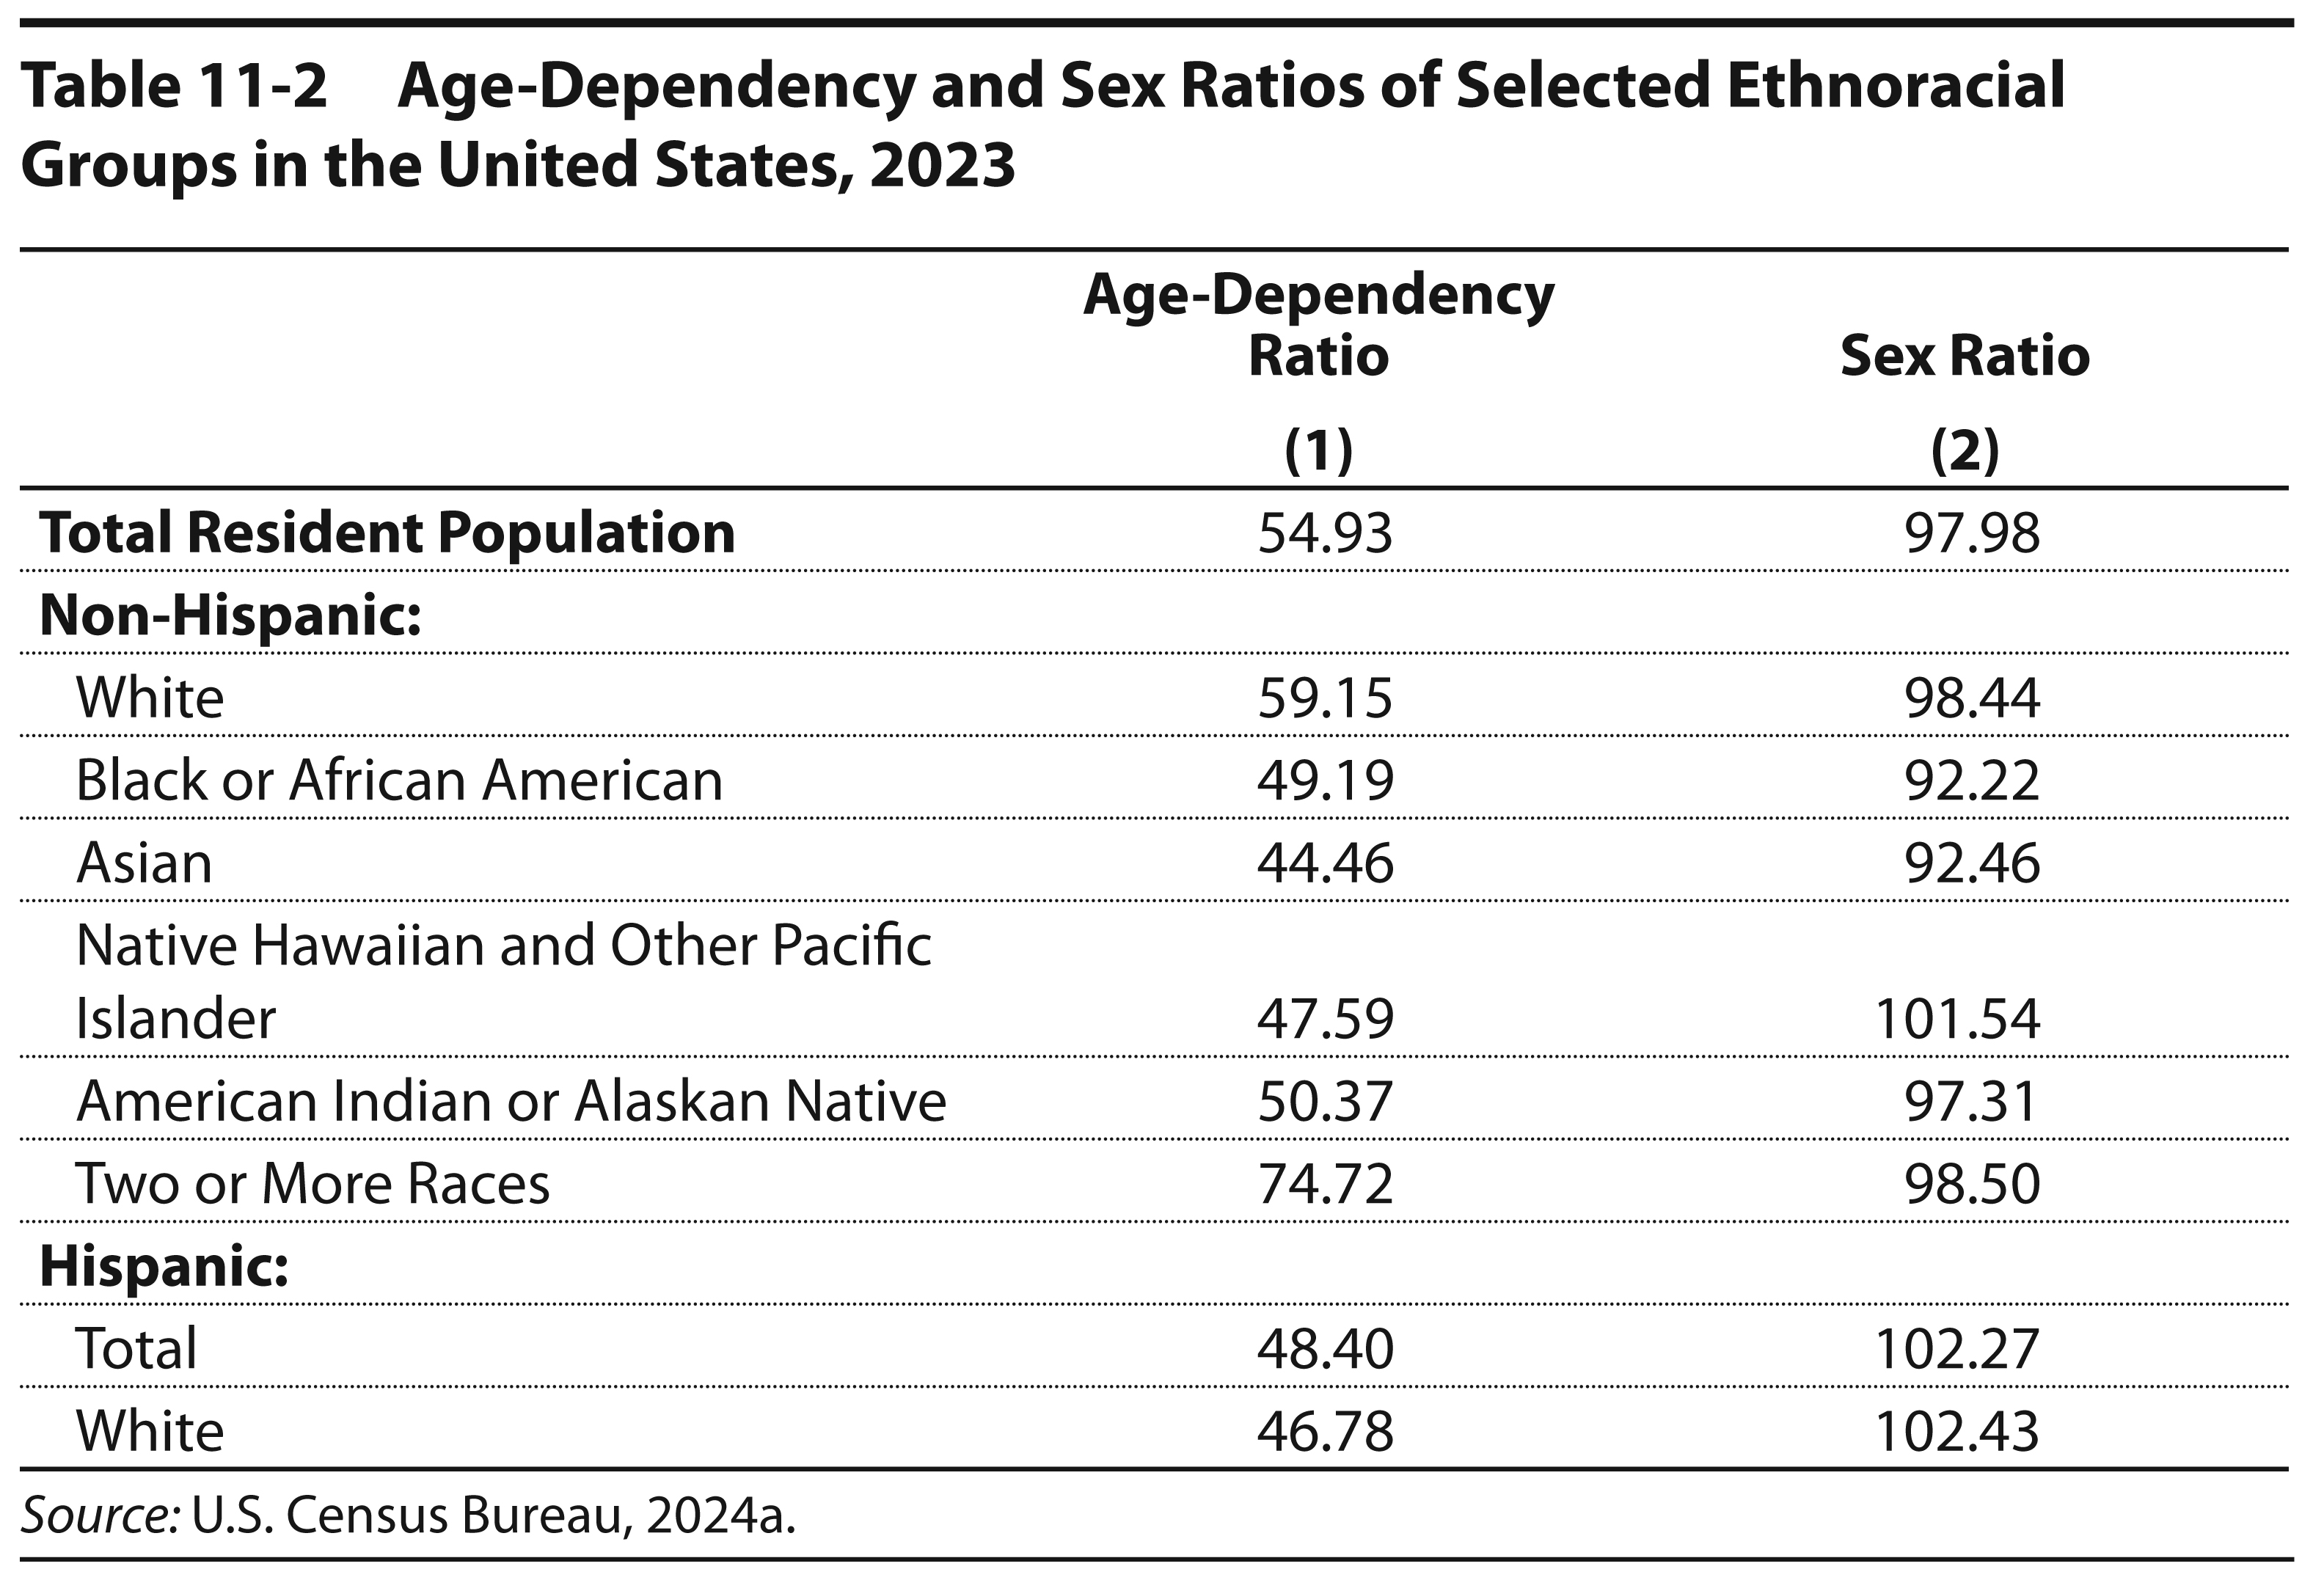
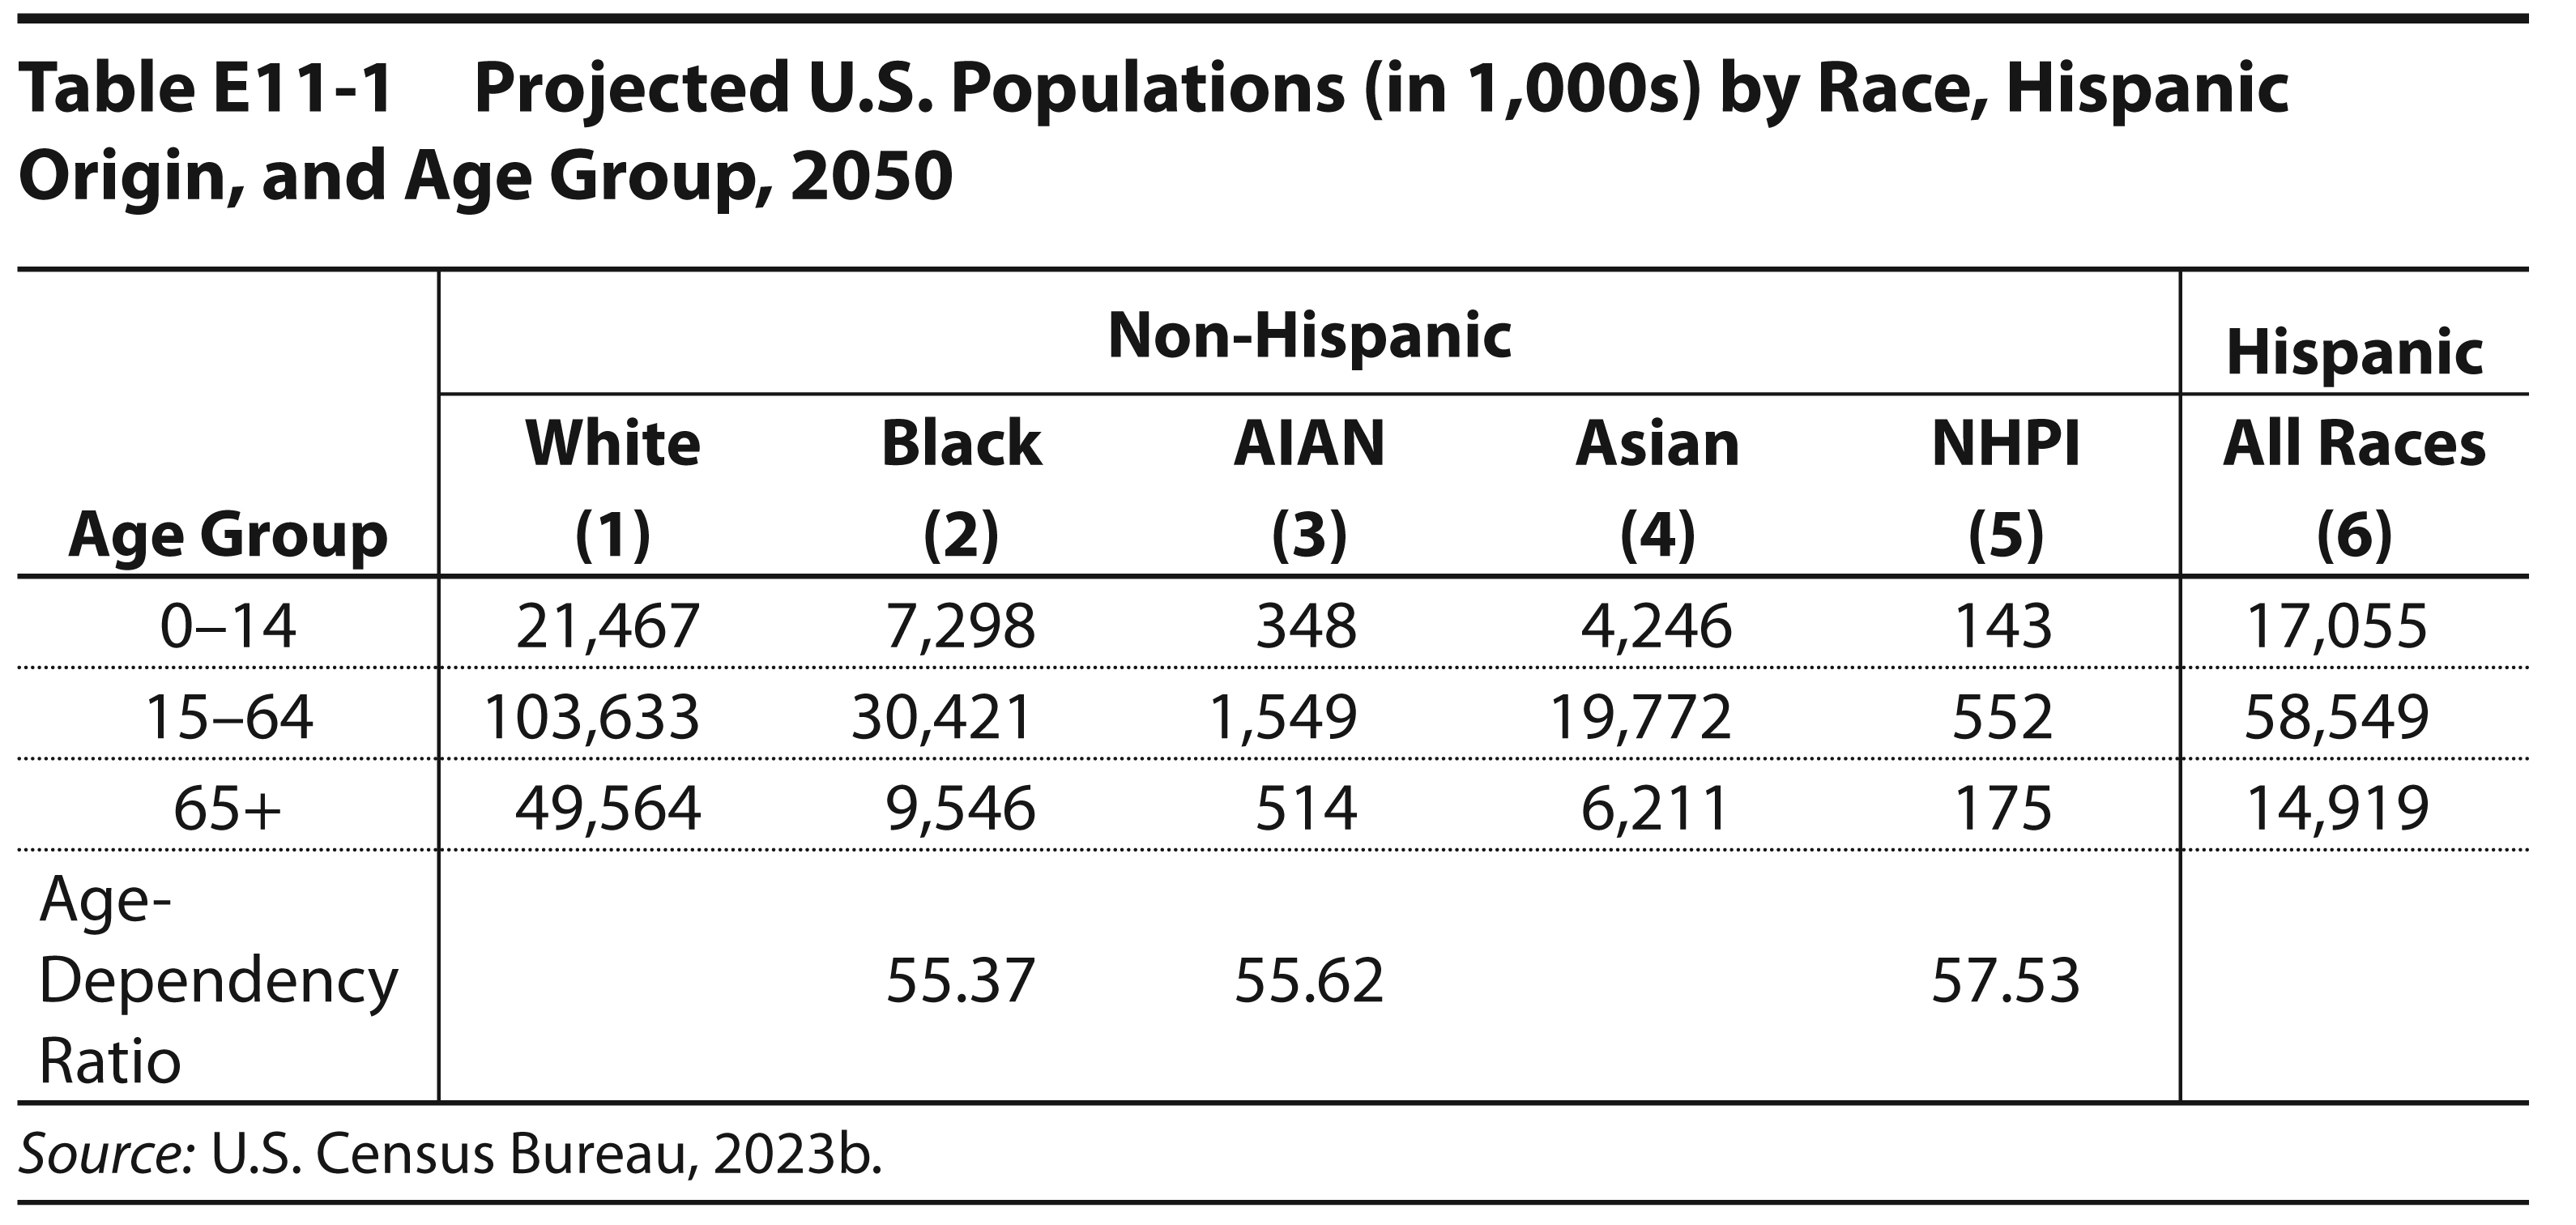
The projected age composition of several ethnic groups in 2050 is summarized in Table E11-1. Using this information and formulas from chapter 4, compute and fill in the missing age-dependency ratios for non-Hispanic White, Asian, and Hispanic populations.
Exercise 2
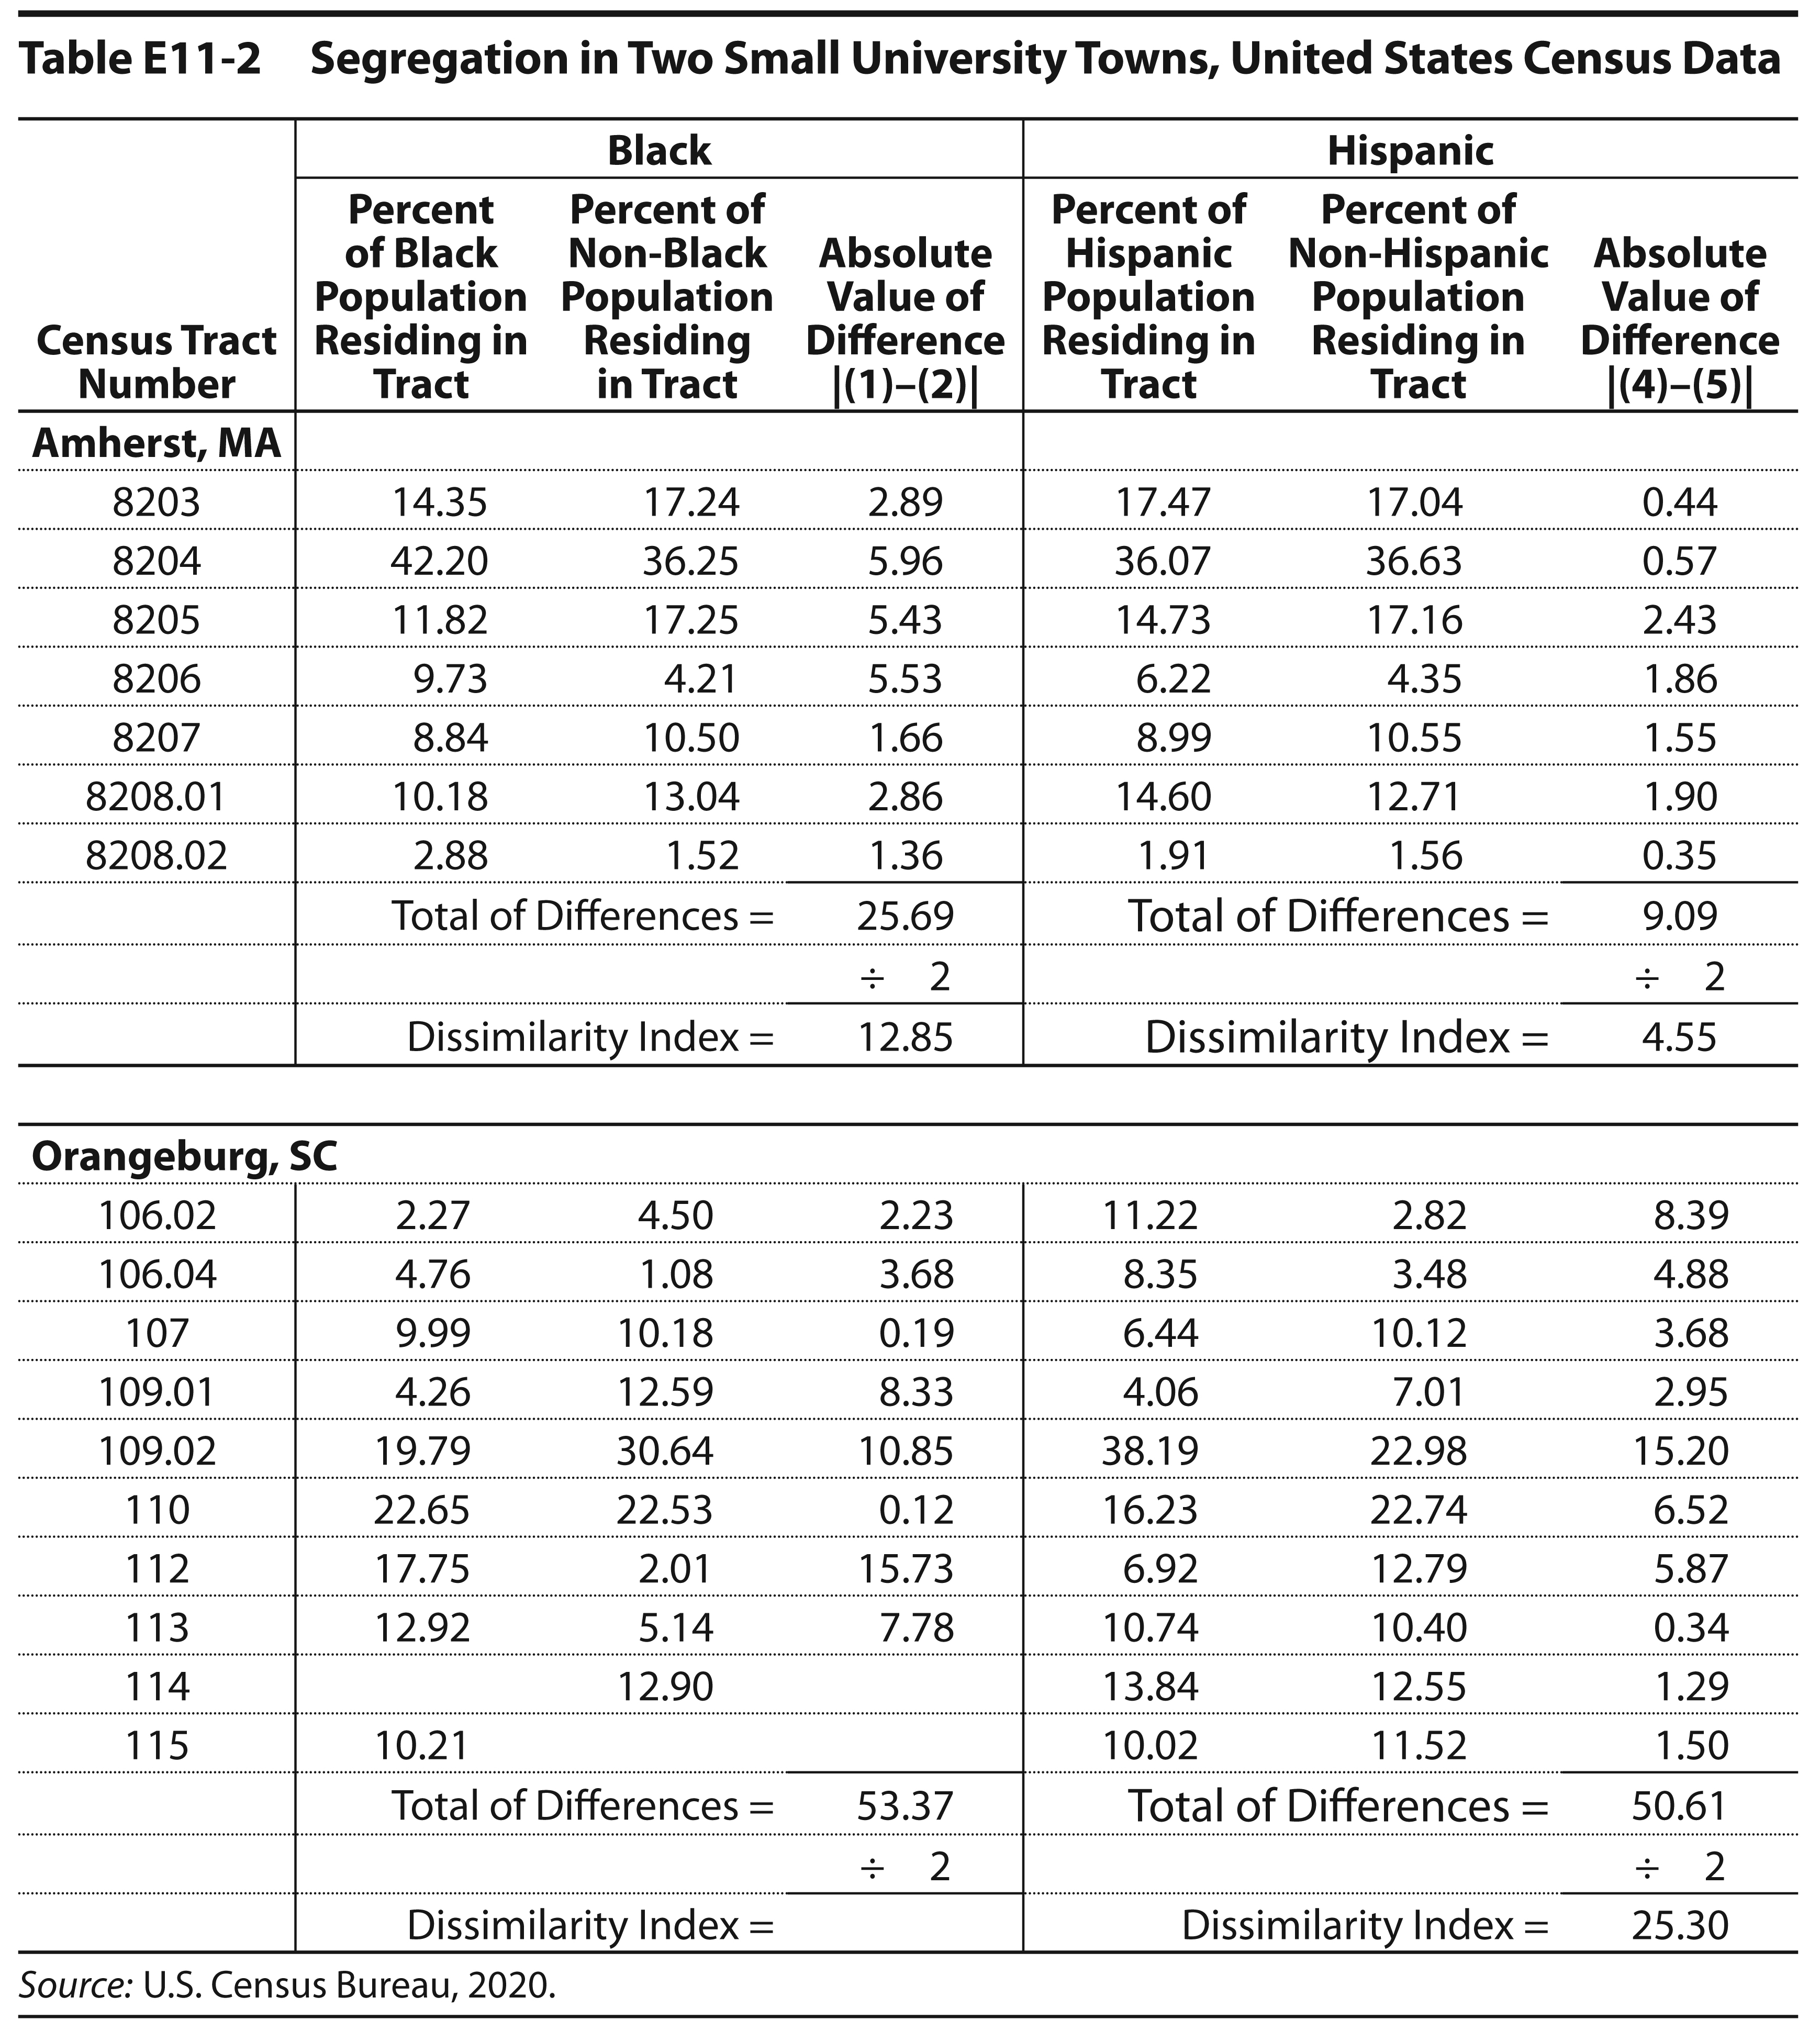
The calculation of dissimilarity indices are illustrated for two small university towns in Table E11-2. Computations are complete for the town of Amherst, Massachusetts. Fill in the blanks to complete the computations of the dissimilarity index in Orangeburg, South Carolina. (Use the fact that the first two columns of this table should total to 100% to derive the missing entries in those columns.) Then, answer the following questions about the results: