Chapter 3 Exercises
-
Table E3-1 shows what would happen to the total population of Japan if it started at 127,587,800 at the midyear of 2012 and decreased by –0.2% (i.e., 2 per thousand or .002) every year until midyear through 2017. Copy the same procedure and apply it to Bangladesh, filling in the blanks in the table. Assume an annual growth rate for Bangladesh of 1.6% (i.e., 16 per thousand). Figures are provided for the year 2012 to get you started. Round off the increment figure to the nearest thousand before adding it to the population as of the beginning of the succeeding year.
-
Plot the projected population of Bangladesh for every year from 2012 to 2017 in Figure E3-1 on the following page. Connect the dots with a freehand line.
-
The implications of a constant growth rate can be expressed dramatically in terms of the years to double at that rate. The formula is
years to double=70% annual growth rate
Suppose that the annual growth rates for the United States and Mexico in 2012 were 0.9% and 1.1%, respectively. How many years would it take for the populations to double? Round to one decimal place.
U.S. doubling time
Mexico doubling time
-
NOTE: Gapminder World has updated their tools!!!
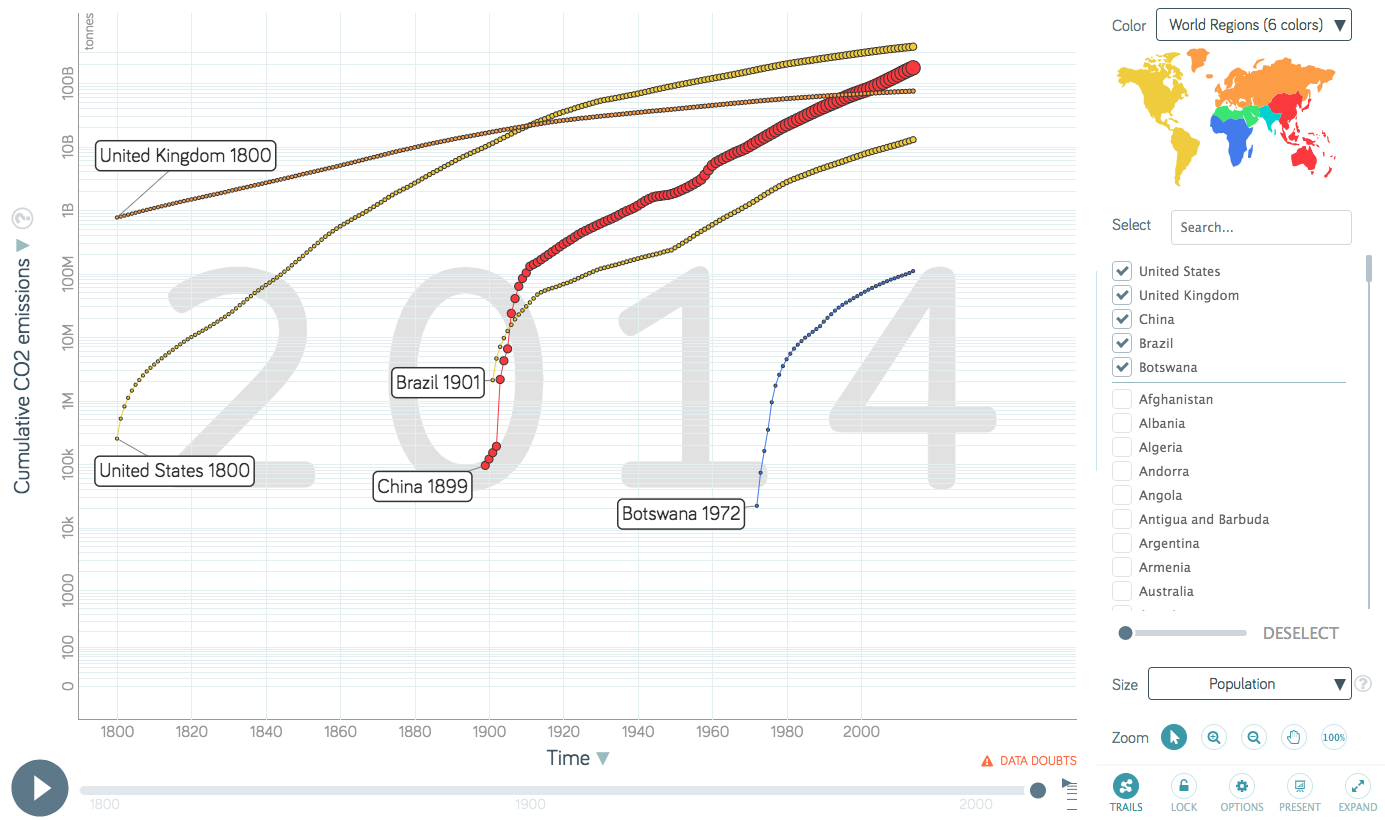
This instruction applies to the new version. Click on the graph which shows carbon emissions over time. On the right hand select tool, select China, United States, United Kingdom, Brazil, and Botswana, and then choose total population for size. Click play to see the cumulative CO2 emissions from 1751–2014. Describe the trends you see.
Now change the Y-axis measurement on the left hand side from cumulative emissions to emissions per person by changing the Y-axis to “CO2 emissions (tonnes per person).” Click play. Describe the trends you see compared to the previous example.
-
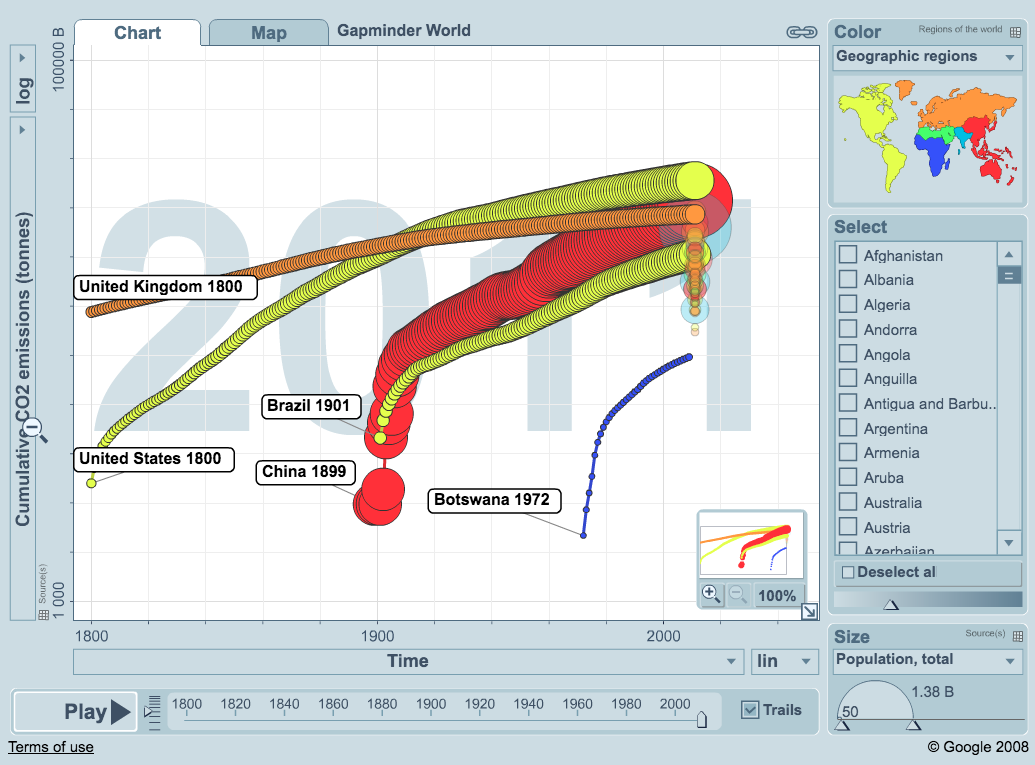
This instruction applies to the old version. Click on the graph which shows carbon emissions over time. On the right hand select tool, select China, United States, United Kingdom, Brazil, and Botswana. Click play to see the cumulative CO2 emissions from 1800–2011. Describe the trends you see.
Now change the Y-axis measurement on the left hand side from cumulative emissions to emissions per person by changing the Y-axis to “CO2 emissions (tonnes per person).” Click play. Describe the trends you see compared to the previous example.
Charts
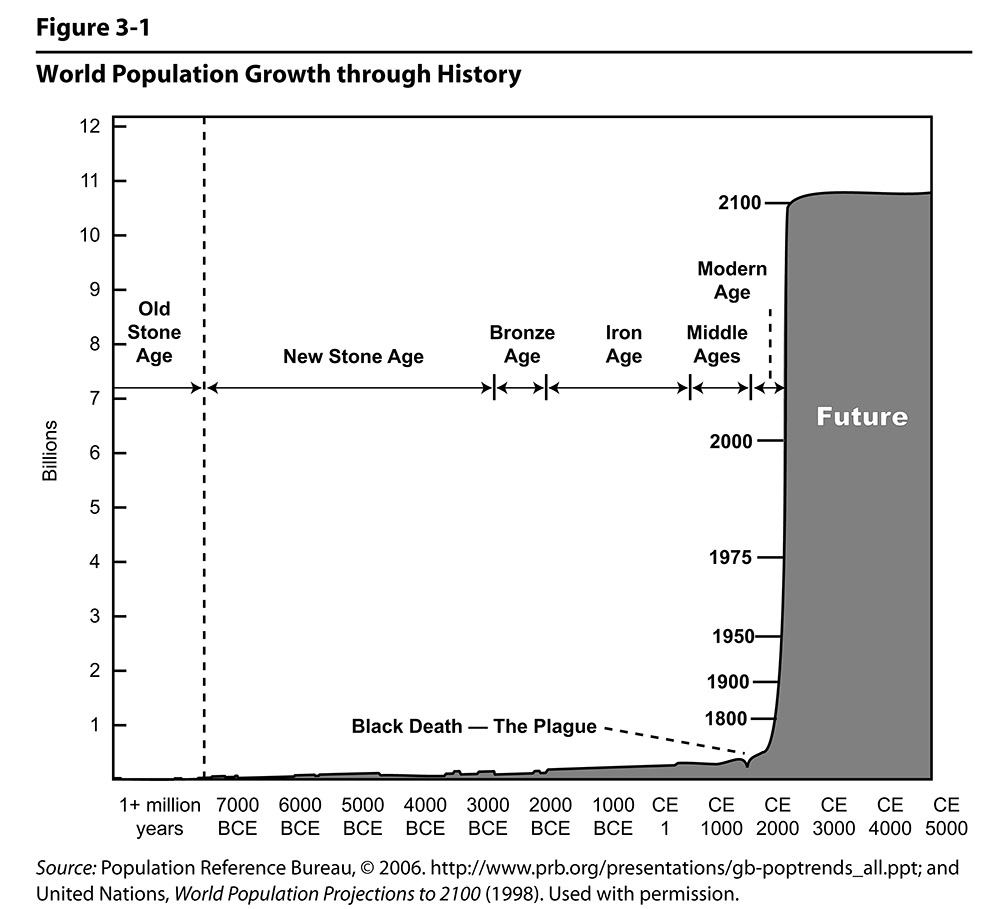
Figure 3.1
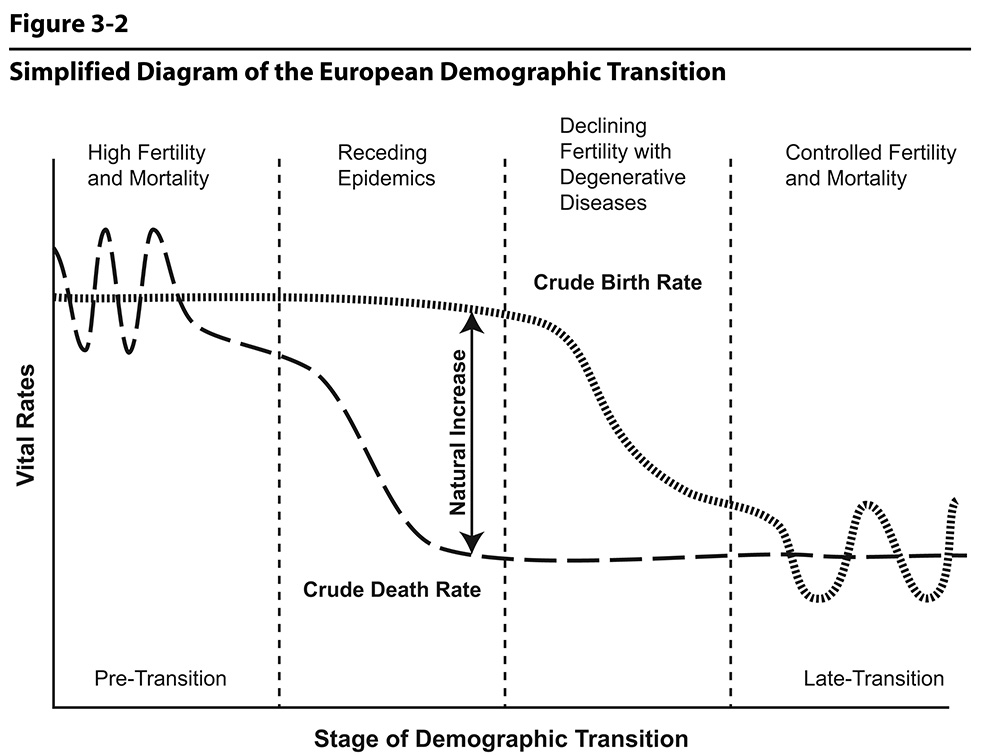
Figure 3.2

Figure 3.3
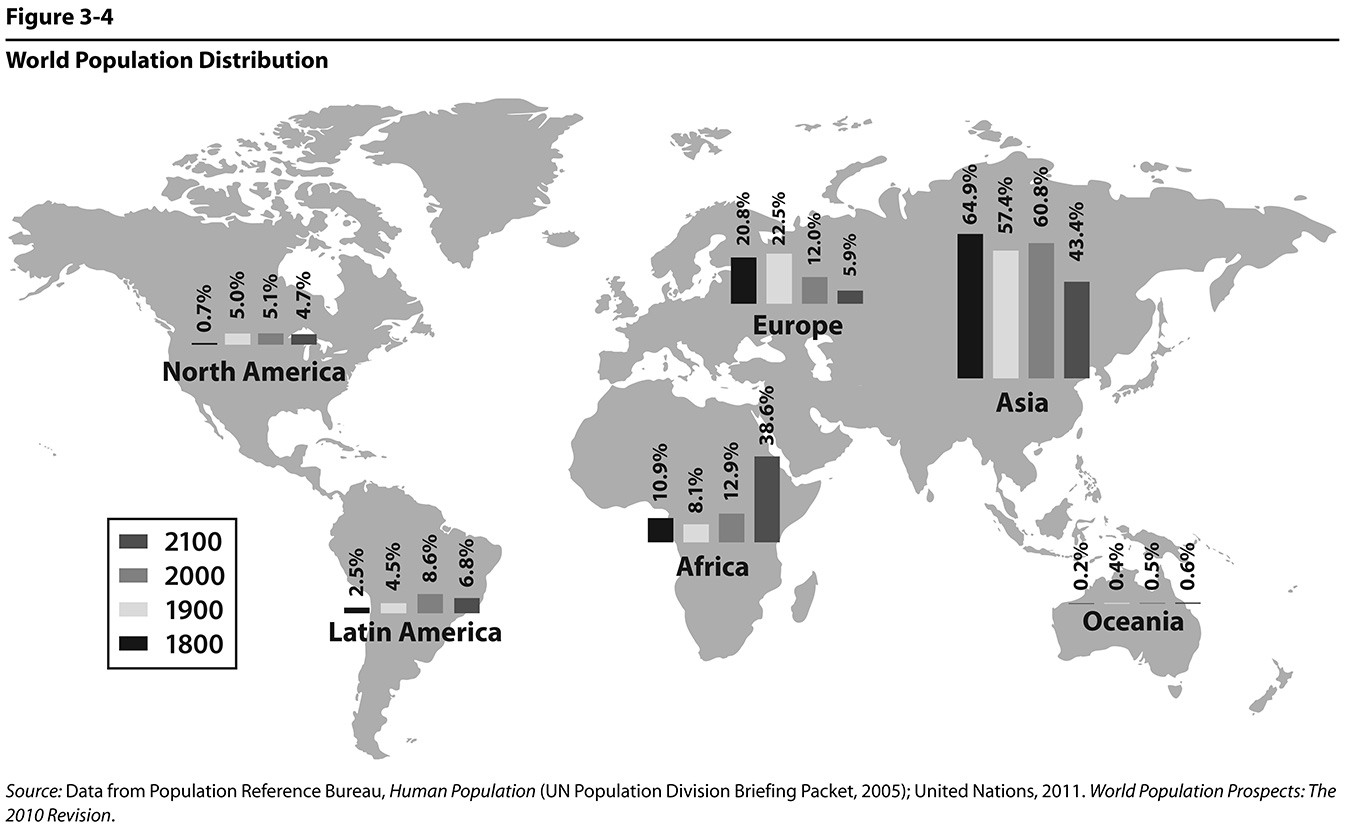
Figure 3.4
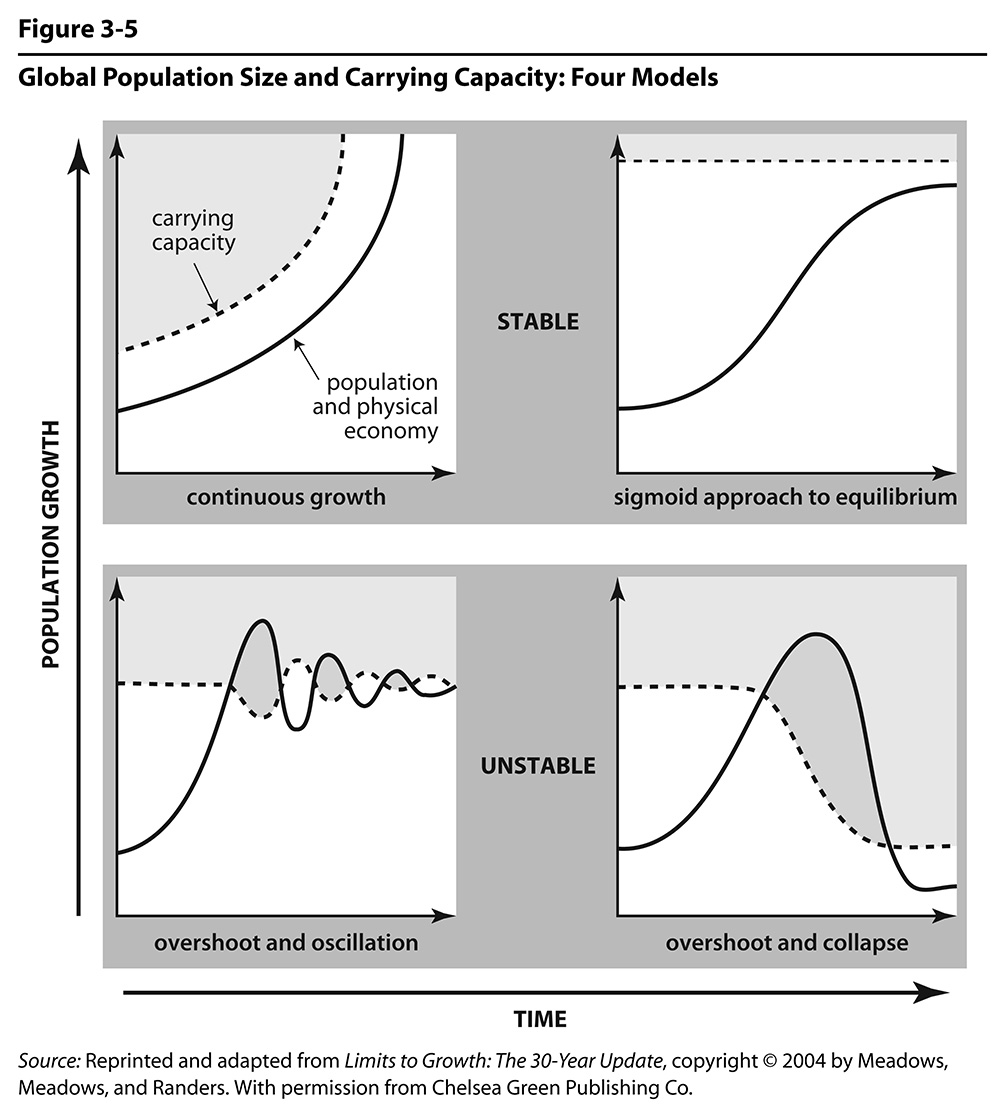
Figure 3.5
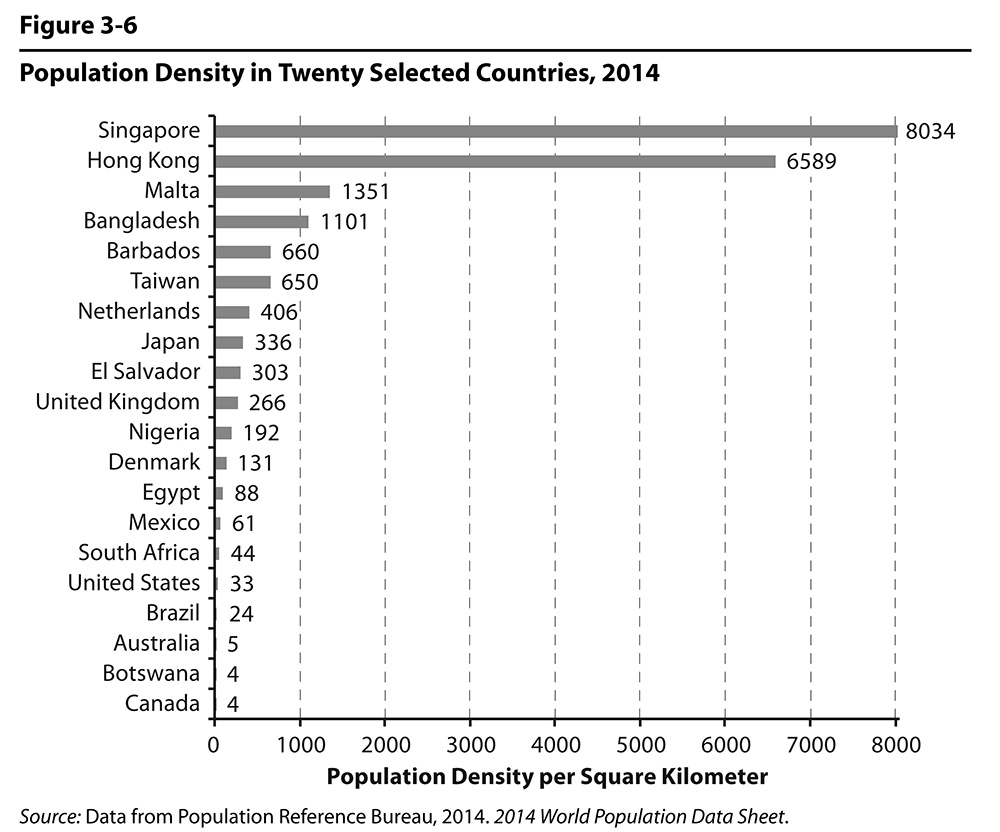
Figure 3.6