Chapter 8 Exercises
Age Standardization
-
Suppose you are making a historical contrast between the 1890 and the 2015 U.S. male marital status compositions. You are aware that one reason for a change in marital status composition might be an aging population during the past century (see chapter 4). You might want to know how much of the marital status change is attributable to changes to age structure. Thus, you might ask what the 1890 marital status composition would have been if it had that older 2015 age structure. To do this you could standardize 1890 to the 2015 age distribution using the direct method, as follows.
First, record different information about the two dates in a standardization table, such as Table E8-1. The number of men in each age category (excluding those under age fourteen) for the standard population of 2015 would be recorded in column 1 of the top panel in Table E8-1. For the 1890 population, record the proportion in each age category falling into each marital status (see columns 2, 3, 4, and 5 of the top panel of Table E8-1). Using these source data, make the following computations, filling in the blanks in the exercise table.
-
Multiply each of the proportions for 1890 in columns 2 through 5 against the 2015 population for the appropriate age category found in column 1. Record the resulting expected numbers upon 1890 standardization in the middle panel of Table E8-1.
-
For each marital status, accumulate the expected numbers, at all ages, at the foot of columns 2 through 5. Together, these totals form the expected frequency distribution by marital status.
-
Convert this frequency distribution into a percentage distribution. Divide the expected number in each status category by the expected number in all categories combined (125,982,435).
The bottom row of Table E8-1 presents, for comparison, the actual (nonstandardized) percentage distribution by marital status of the 1890 male population aged fourteen and over. What are the differences from the standardized 2015 population and why?
Calculating Annual Rates
-
Table E8-2 contains data to compute the Japanese crude marriage and divorce rates (per 1,000 population) and the more refined general divorce rate (per 1,000 married adult women) for the years 2010 and 2005. Complete the table by filling in the blank cells for each rate in 2010 and the number of divorces in 2005.
Age at Marriage
-
This interactive graph shows age at first marriage among women over time across three countries, Algeria, Canada, and the Philippines.
-
Which country has the latest age at marriage in 1966, 1986, and 2005?
-
How would you explain these trends?
-
Now focus just on Canada and pull back the time bar to 1915. How do Canadian age-at-marriage trends play out over the time period?
Charts
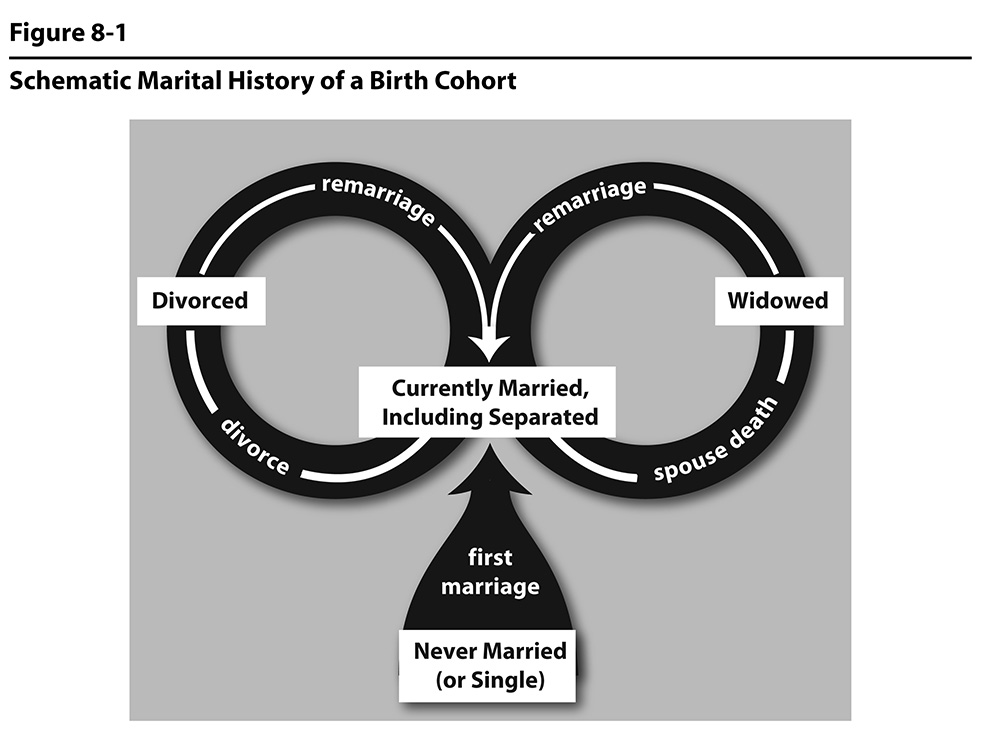
Figure 8.1

Figure 8.2
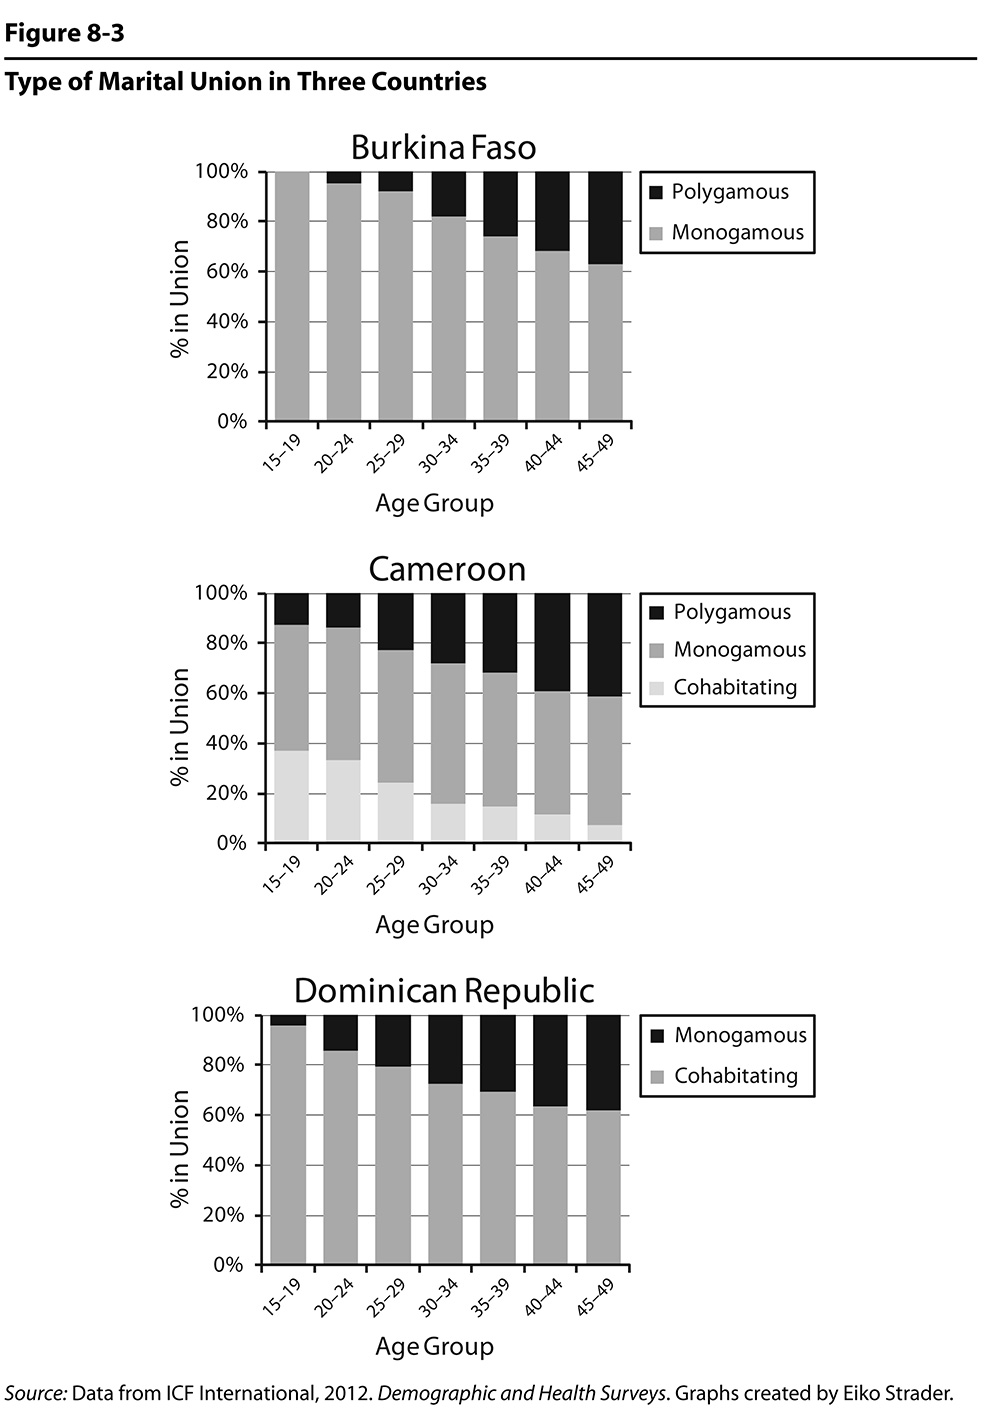
Figure 8.3

Figure 8.4
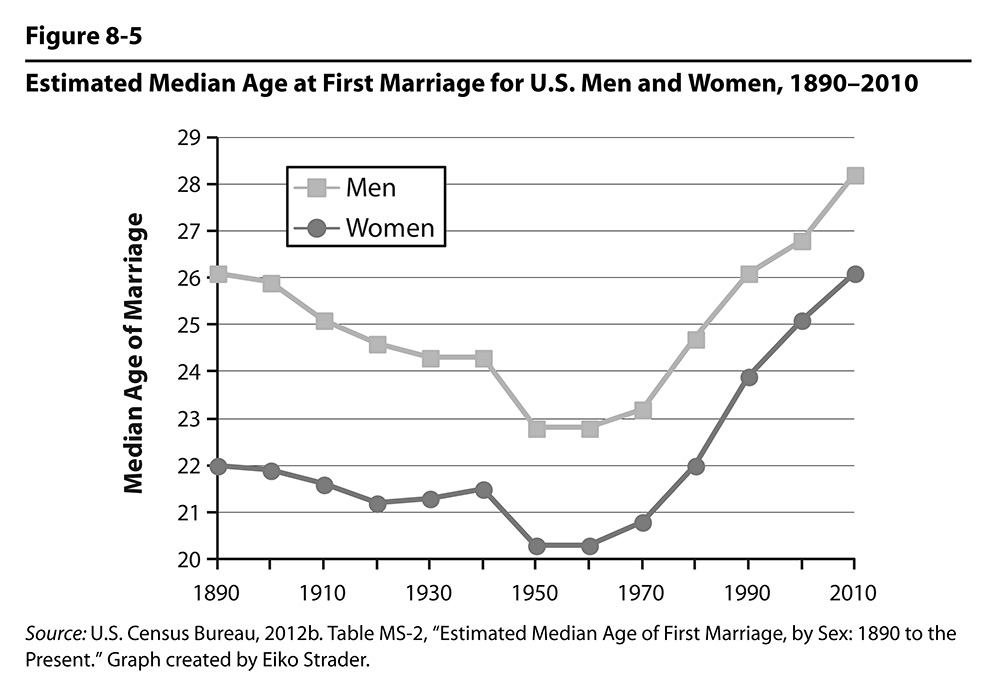
Figure 8.5
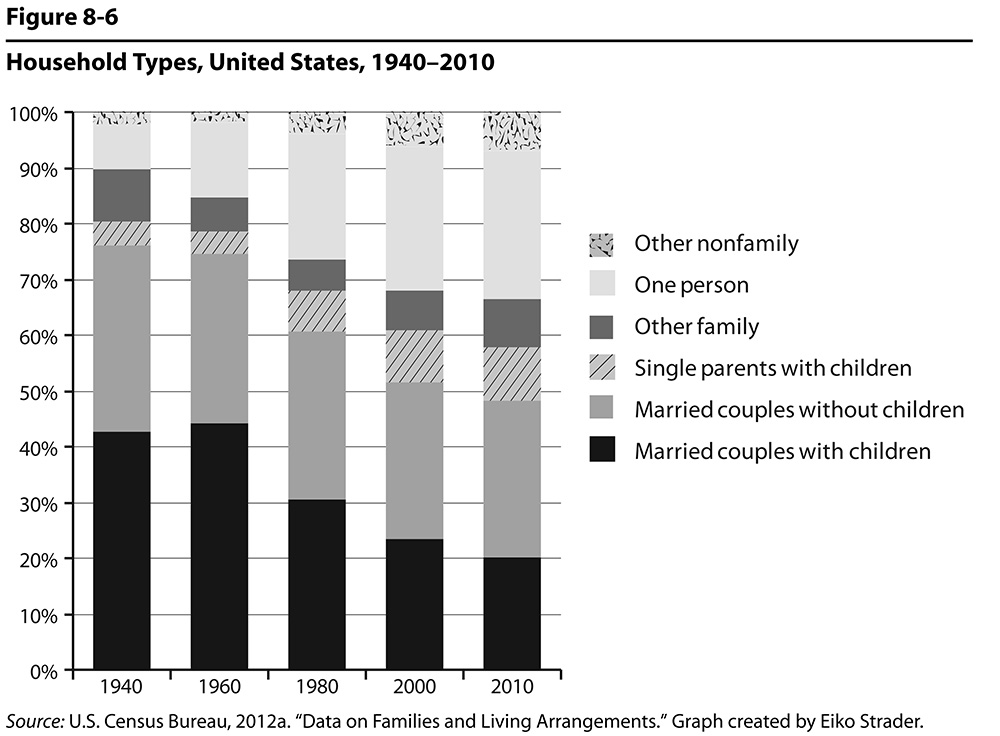
Figure 8.6
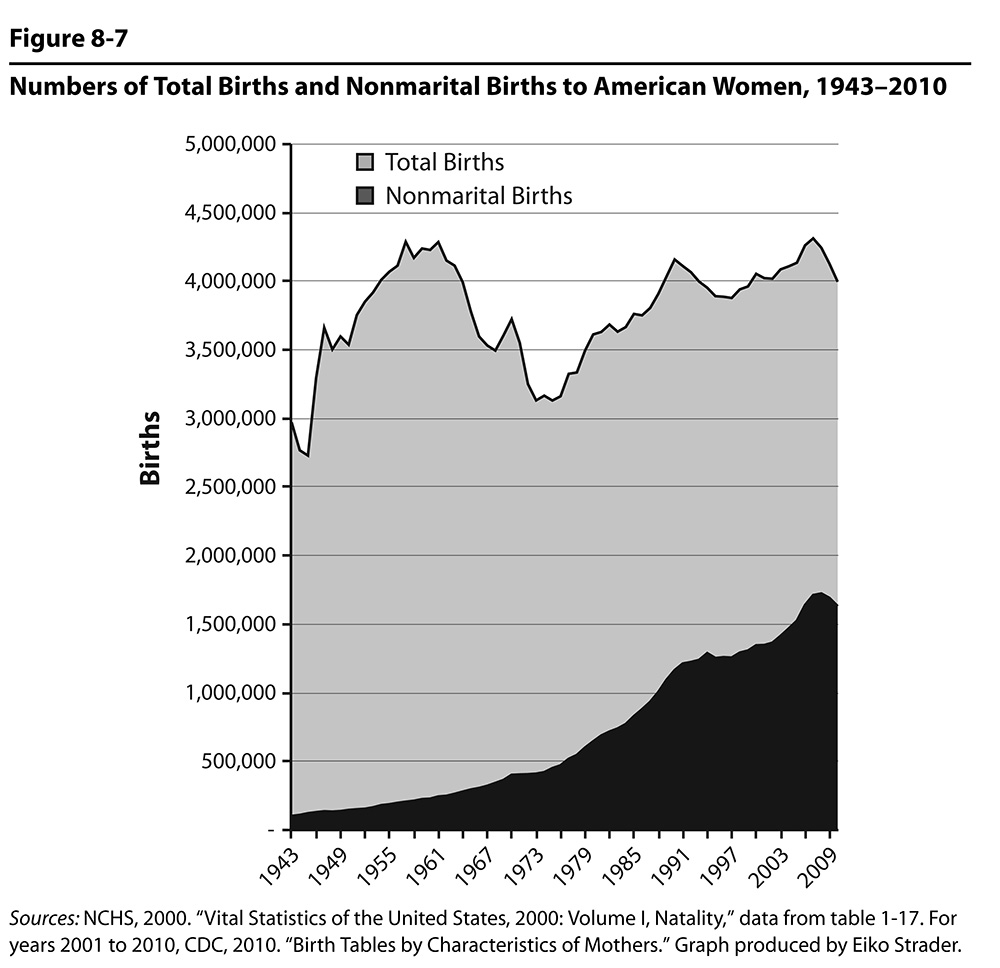
Figure 8.7
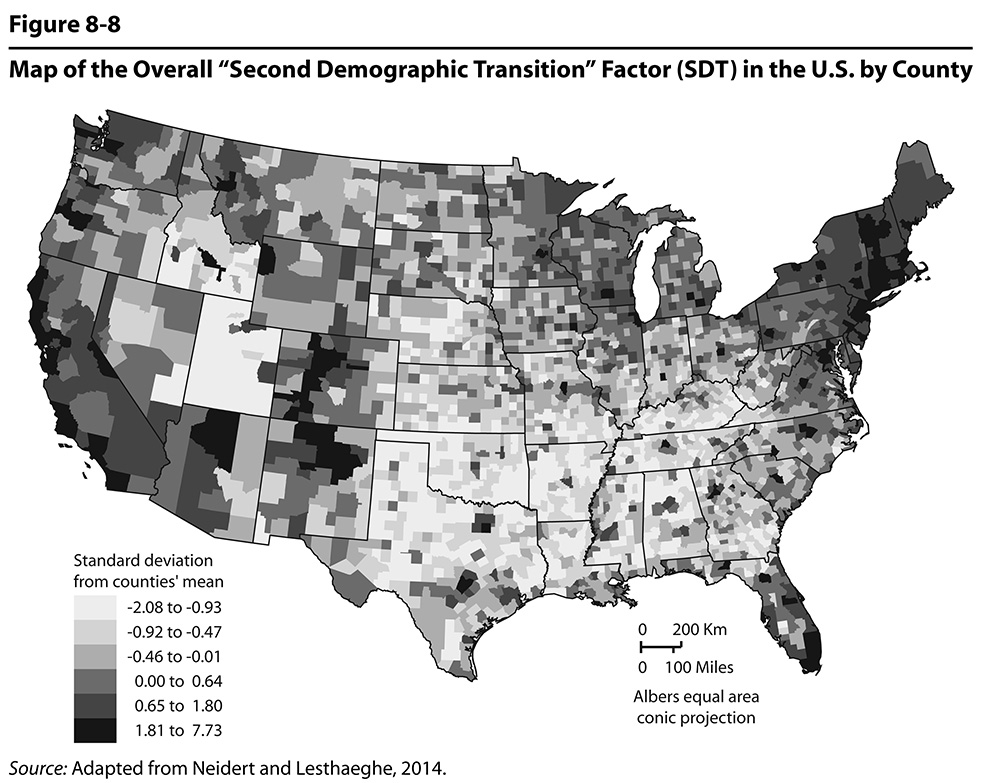
Figure 8.8
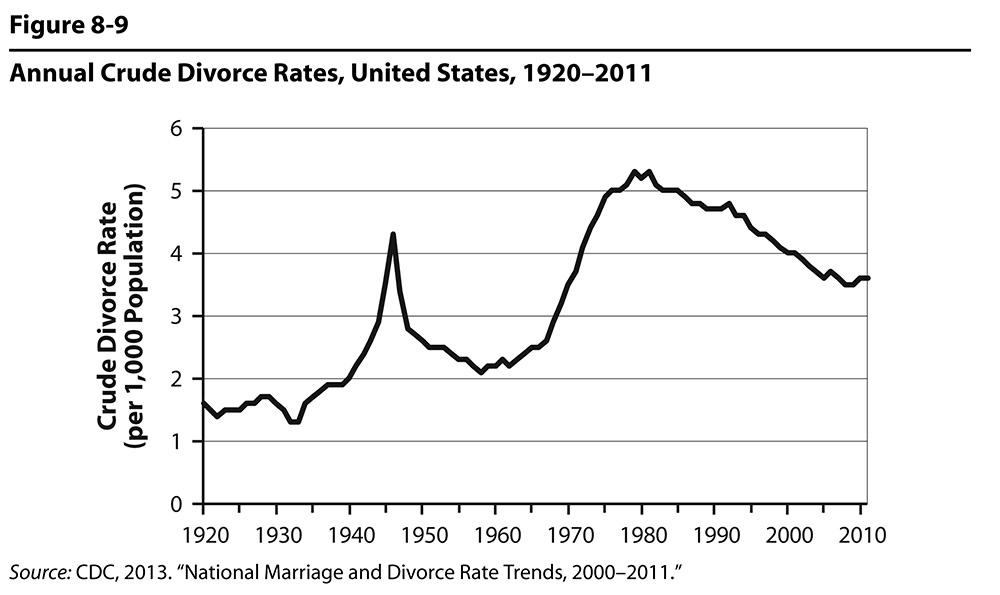
Figure 8.9
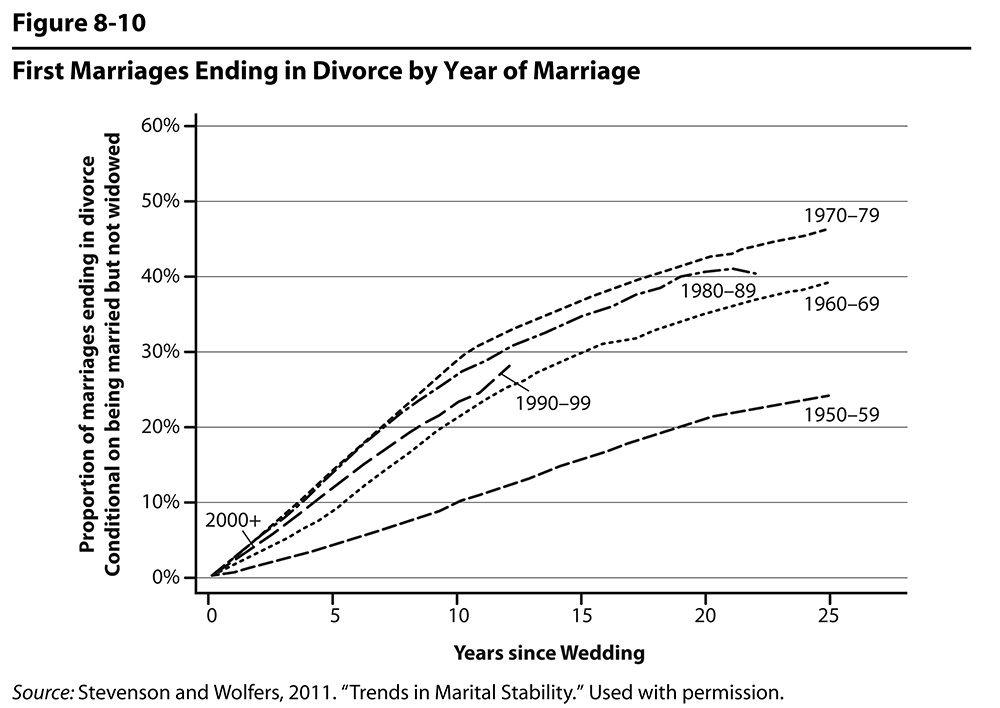
Figure 8.10