Chapter 10 Exercises
-
Watch Hans Rosling’s four-minute video on urbanization under and answer the following questions:
-
In two sentences summarize the trends he shows.
-
What is the urban challenge he refers to?
-
What does he think the advantages of urbanization are?
-
Compute measures of the degree of urbanization in China, using the data and examples in Table E10-1.
-
Compute the percentage of the total population living in urban places for 1990 and 2020, rounding to one decimal place, and record them in the blank spaces of the table.
-
Compute the ratio of the urban population to the rural population for 2000 and 2030, rounding to one decimal place, and record them in the blank spaces in the table.
<
-
Compute measures of the pace of Chinese urban growth and of urbanization, using the data in Table E10-1 and examples in Table E10-2.
-
Compute ratios of urban growth for 1990–2000 and 2010–2020. Do this by dividing the later urban population by the earlier urban population and multiplying the quotient by 100. Round to one decimal place and record in the blank spaces in Table E10-2.
-
Compute the ratios of rural growth for 1990–2000 and 2010–2020, using the same procedure. Round to one decimal place and record in the blank spaces in Table E10-2.
-
Compute the ratio of the urban-growth ratio to the rural-growth ratio for 1980–1990 and for 2000–2010. Multiply by 100, round to the nearest whole number, and record in the blank spaces of Table E10-2. This is one measure of the pace of urbanization.
-
If the figure in the bottom row for a given decade were less than 100, that would mean that (check one):
the urban growth ratio was less than the rural growth ratio. the urban population did not grow. less than half the population lived in urban places during the decade. all of the above.
-
Compute net total migration for the United States between 2011 and 2012 using the data in Table E10-3.
-
Compute the net total migration for principal cities, suburbs, and nonmetropolitan areas in column 3. Enter your answers in the blank spaces of the table.
Charts

Figure 10.1

Figure 10.2
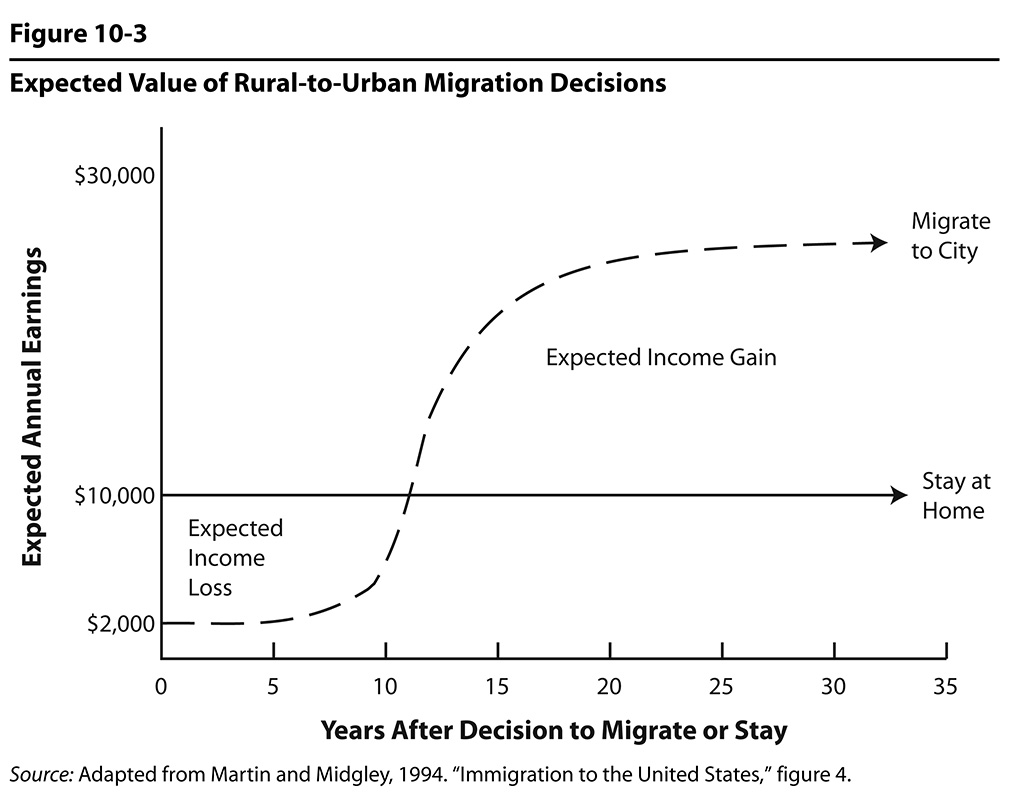
Figure 10.3
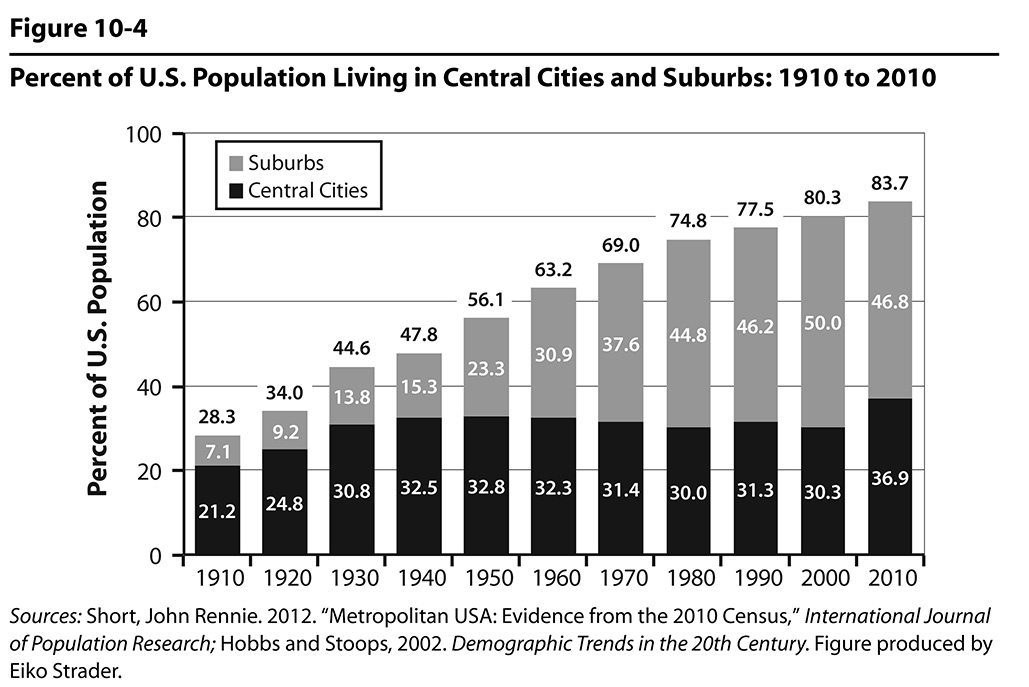
Figure 10.4